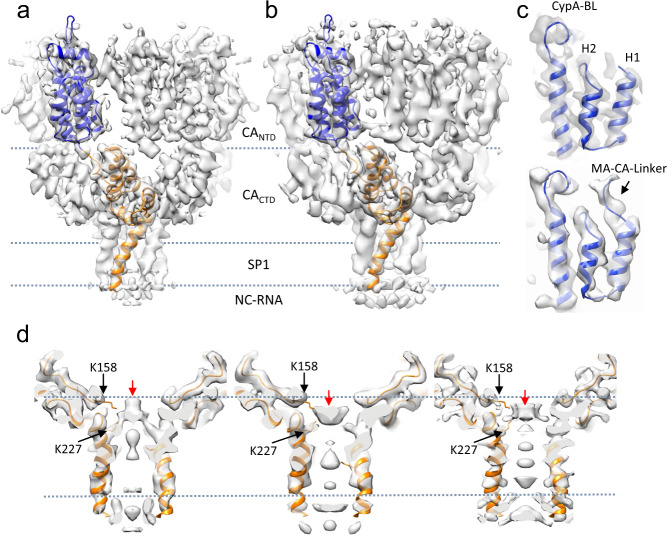
Fig. 2. Structures of immature GagT8I CA-SP1 by subtomogram averaging.
a, b The density maps of immature Gag CA-SP1 from GagΔMAT8I assemblies (a) and GagT8I VLPs (b), overlaid with the refined respective atomic models shown in blue (CANTD) and orange (CACTD-SP1). Domain regions are labelled. c Enlarged views of CypA-binding loop (CypA-BL) and N-terminal MA-CA linker in GagΔMAT8I assemblies (top) and GagT8I VLPs (bottom). d Detailed views of the central densities within the six-helix bundle of GagΔMAT8I assemblies (left), GagT8I VLPs (middle) and GagΔMAT8I assemblies with 10 µM IP6 (right). Black arrows point to the lysine residues from CACTD, K158 and K227, forming two-rings to coordinate a central density (red arrows). Dashed lines mark the same height in both density maps.

