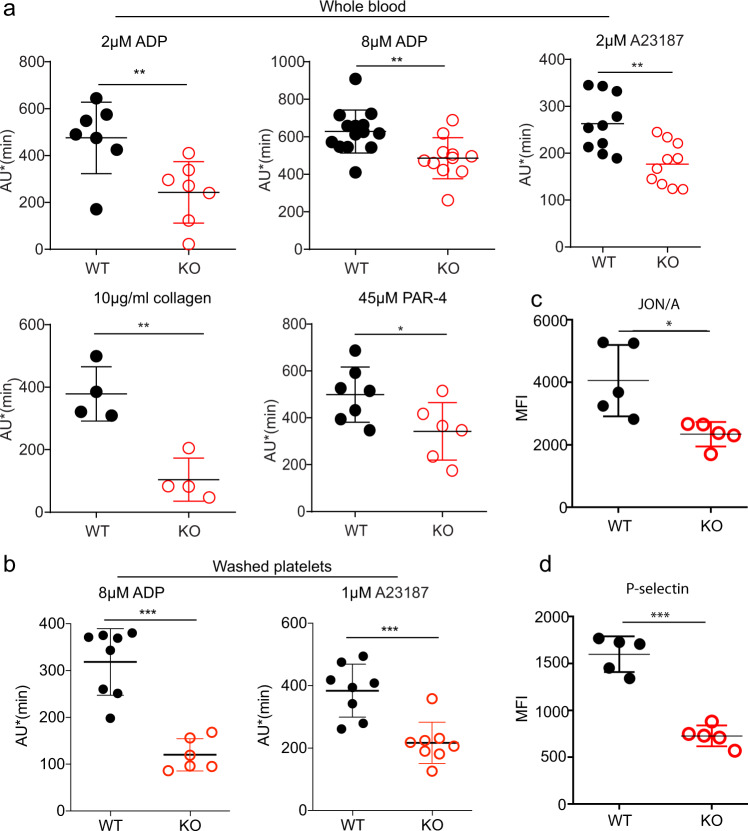
Fig. 5. Mfsd2b KO platelets exhibited reduced aggregation.
a aggregation assays of whole blood isolated from WT and Mfsd2b KO mice with indicated agonists. Whole blood samples from WT and KO mice were activated with indicated concentrations of agonists. Aggregation ability was measured by an aggregometry analyzer and shown as area under the aggregation curve (AU). Data are mean and SD. Each dot represents one mouse (n = 7 for 2 μM ADP activation; n = 14 for WT and n = 11 for KO for 8 μM ADP activation; n = 10 for 2 μM A23187 activation; n = 4 for 10 μg/ml collagen activation; n = 7 for WT and n = 6 or KO for 45 μM PAR-4 activation experiments). **P < 0.01, two-tailed unpaired t-test was used. ADP adenosine diphosphate, A23187 calcium ionophore, PAR-4 protease-activated receptor-4, JON/A platelet glycoprotein GPIIb/IIIa. b aggregation assays of washed platelets isolated from WT and KO mice with indicated agonists. Washed Mfsd2b knockout platelets exhibited significantly impaired aggregation compared with WT controls as observed in the whole blood samples. Data are mean and SD. Each dot represents one mouse (n = 8 for WT and n = 6 for KO for 8 μM ADP activation; n = 8 for 1 μM A23187 activation experiments). ***P < 0.001, two-tailed unpaired t-test was used. AU area under the aggregation curve. c, d Mfsd2b knockout platelets had significantly reduced expression of JON/A and P-selectin to the cell surface after activation with 1 µM A23187. Surface expression of JON/A and P-selectin was analyzed by flow cytometry. See supplementary fig. 10 for gating strategy. Data are mean and SD. Each dot represents one mouse (n = 5). *P < 0.05, ***P < 0.001. Two-tailed unpaired t-test was used. MFI mean fluorescence intensity.

