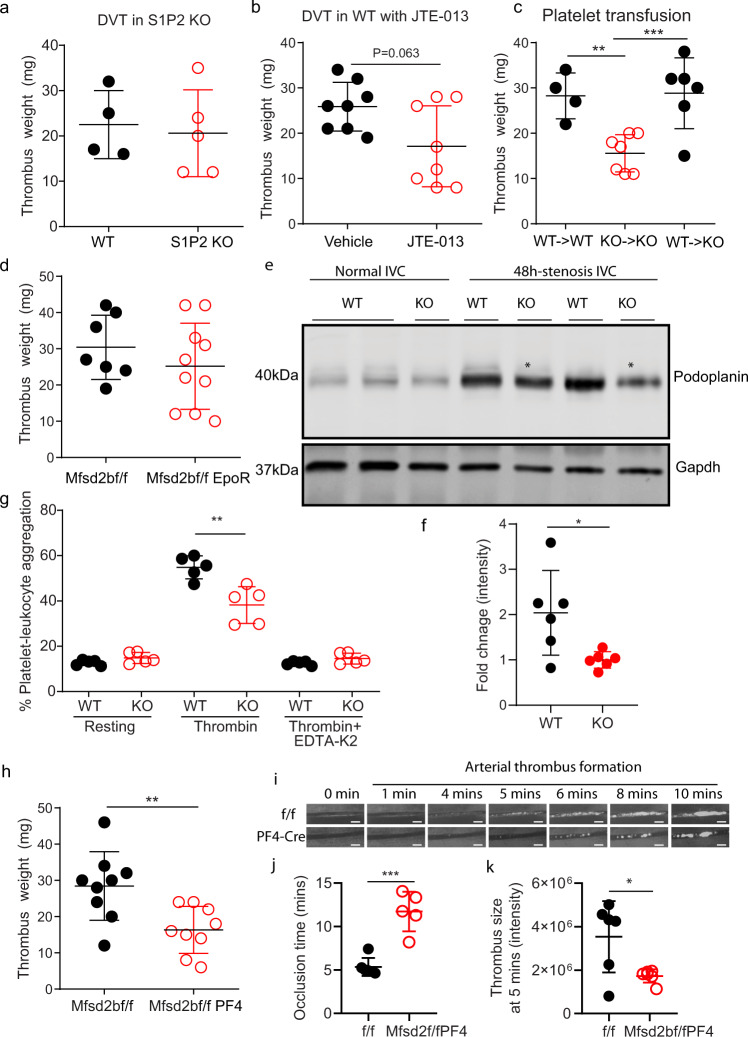
Fig. 8. Deletion of Mfsd2b in platelets reduces thrombosis.
a S1P2 is dispensable for thrombosis. Weights of thrombi collected from WT and S1P2 knockout mice. Each dot represents one animal (n = 4–5). b JTE-013, a S1P2 antagonist, also failed to inhibit DVT in mice. Weights of thrombi collected from WT mice (n = 8) with and without treatment of 30 mg/kg JTE-013. c Platelet transfusion. Transfusion of WT platelet to WT or KO mice, respectively and vice versa. The indicated recipient mice were assessed for DVT. Transfusion of KO platelets failed to increase DVT formation in KO mice, whereas transfusion of WT platelets to KO mice reversed the reduced thrombosis in KO mice. Each dot represents one animal (n = 4 for WT > WT; n = 7 for KO > KO; n = 6 for WT > KO). **P < 0.01, ***P < 0.001. One-way ANOVA was used. d Deletion of Mfsd2b in erythrocytes using EpoR-cre did not reduce thrombosis. Each dot represents one animal (n = 7–10). e, f Expression of podoplanin in untreated and stenosis IVC from WT and KO mice. In stenosis IVC, thrombi were removed from IVC for western blot analysis. Each dot represents one mouse (n = 6). *P < 0.05. Two-tailed unpaired t-test was used. g Flow cytometry assays of platelets-leukocyte aggregate assays showed that activated Mfsd2b KO platelets exhibited reduced aggregation with leukocytes in comparison with activated WT platelets. See supplementary fig. 10 for gating strategy. Each dot represents one mouse (n = 5). **P < 0.01. One-way ANOVA was used. h Deletion of Mfsd2b in platelets using PF4-cre reduced thrombosis. In the DVT experiments, thrombus weight after 48 h of stenosis were measured. Each dot represents one animal (n = 9). **P < 0.01. Two-tailed unpaired t-test was used. i Time lapse imaging of thrombus formation in mesenteric arteries of Mfsd2bf/f (f/f) and Mfsd2bf/fPF4 (PF4-Cre) mice. j Occlusion time of blood flow in mesenteric artery during thrombosis from Mfsd2bf/f and Mfsd2bf/fPF4 mice. Each dot represents one mouse (n = 6 for Mfsd2bf/f; n = 5 for Mfsd2bf/fPF4). ***P < 0.001. Two-tailed unpaired t-test was used. k Thrombus sizes quantified by fluorescence intensity of the thrombus occurred at 5 min from Mfsd2bf/f and Mfs2bf/fPF4 miceEach dot represents one animal (n = 6). *P < 0.05. Two-tailed unpaired t-test was used. Scale bars in i: 100 μm. Data are mean and SD in all panels.

