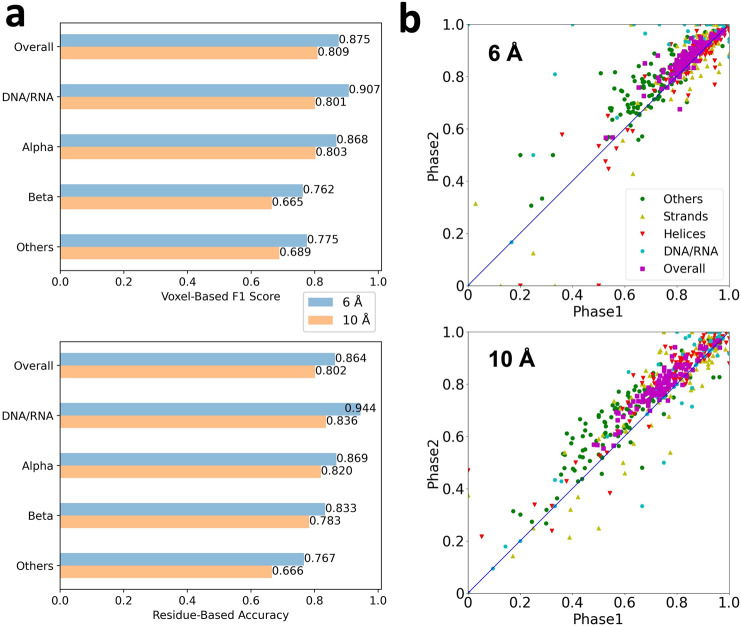
Fig. 2. The structure detection performance on the simulated map dataset.
The dataset consists of 108 structures computed at two different resolutions, 6 Å and 10 Å. a Voxel-based F1 score and Q4 residue/nucleotide-based accuracy for 6 Å (blue) and 10 Å (orange) maps. b Comparison of Q4 of phase 1 and phase 2 network outputs for each of 108 test simulated maps computed at 6 Å and 10 Å. Green, other structures; yellow triangles, β strands; red triangles, α helices; cyan, DNA/RNA; magenta, overall Q4.

