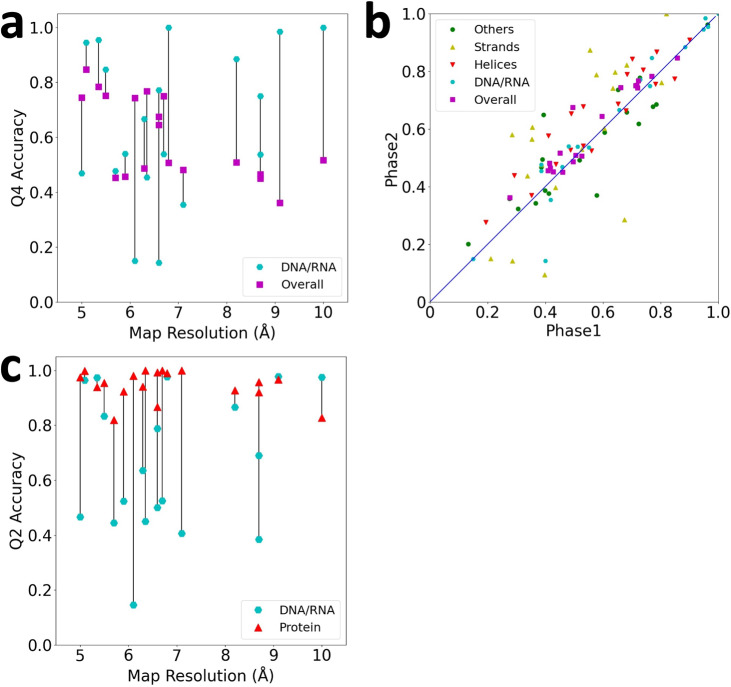
Fig. 4. Structure class detection on 19 experimental maps.
See Supplementary Data 2 for the phase 1 and phase 2 accuracy of individual maps. a Q4 accuracy of experimental maps relative to the map resolution. Overall Q4 is shown in magenta squares and Q4 of DNA/RNA is shown in cyan circles. Lines connect values of the same map. b The residue-based accuracy comparison between the Phase 1 and Phase 2 networks. c Q2 binary classification accuracy for distinguishing the protein and DNA/RNA classes in experimental maps. Note that values for DNA/RNA can be different from panel a, which reports the results of four-class classification. Since the probability of the protein class was computed as the sum of probabilities of three secondary structure classes, a DNA/RNA assignment in the four-class classification can be changed to protein in the binary classification. Results of individual maps are provided in Supplementary Data 2.

