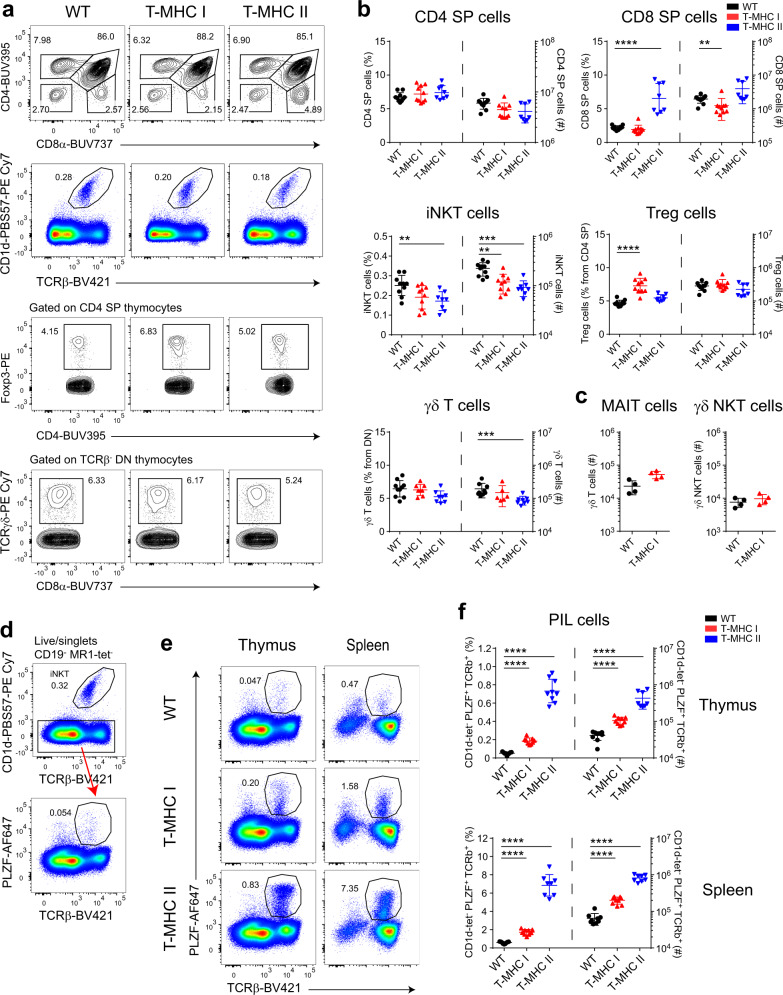
Fig. 2. Expression of MHC I on DP thymocytes increased PLZF+ innate-like T cells (PILs) and decreased NKT cell numbers.
a Representative flow cytometry plots of total thymocytes from WT, T-MHC I, and T-MHC II mice. b Data quantification according to the gating strategy displayed in a. Cell frequencies are plotted on the left axis and numbers on the right axis. c Total cell counts of MAIT cells and γδNKT cells in the thymus of WT and T-MHC I mice. d Representative plots of flow cytometry strategy for the identification of PIL cells in WT thymus. e Representative flow cytometry plots of staining for PIL cells comparing WT with T-MHC I and T-MHC II mice from the thymus and spleen. f Frequency (plotted on the left axis) and number (plotted on the right axis) of PIL cells from WT, T-MHC I, and T-MHC II mice defined by the flow cytometry strategy depicted in d. b, c, f Each point represents one animal: n = 10 animals per group (WT and T-MHC I groups) and n = 8 animals (T-MHC II group) in b, n = 4 animals per group in c and n = 9 animals per group in f. Data are representative of five in a, b and eight in d–f independent experiments. One experiment was performed in c. Unpaired two-tailed Mann–Whitney test was performed in b, c, f); p ≥ 0.01 are not depicted, **p < 0.01, ***p < 0.001, and ****p < 0.0001. Data are presented as mean values ± SD. Source data are provided as a Source Data file.

