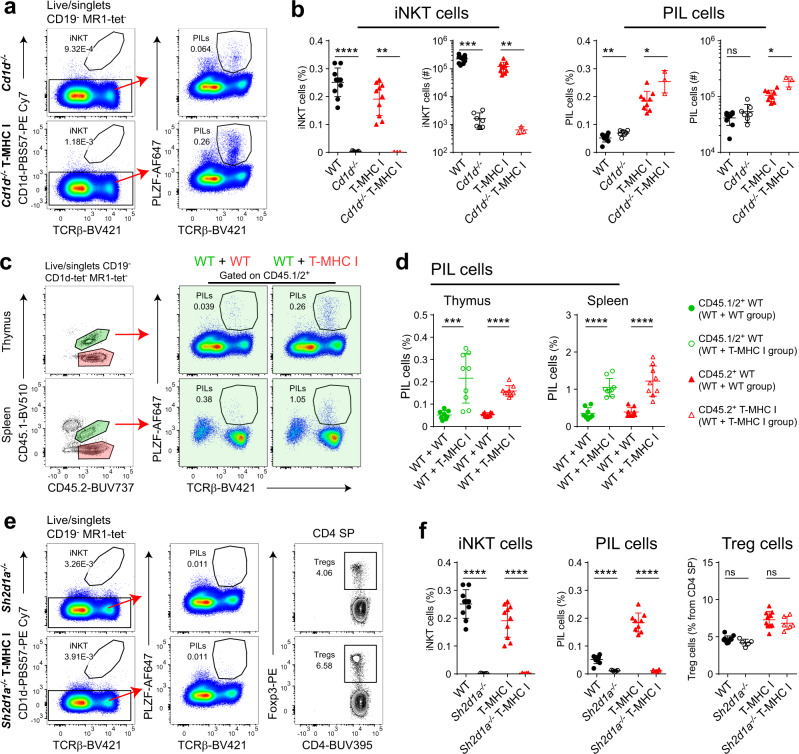
Fig. 3. PIL T cells are SAP dependent and require MHC I in a cell-extrinsic manner.
a Representative flow cytometry plots of total thymocytes from Cd1d−/− and Cd1d−/− T-MHC I mice. b Thymic iNKT and PIL cell frequency and number comparison between WT and Cd1d−/−, and T-MHC I and Cd1d−/− T-MHC I mice. c Representative flow cytometry plots from a set of unequal bone marrow (BM) chimeric mice 8 weeks post transplantation. WT CD45.1+ mice were lethally irradiated and transplanted with a mix of WT CD45.1/2+ and T-MHC I CD45.2+ bone marrow at a ratio of 1 : 10. This experimental group is depicted as WT + T-MHC I group. In the control group, mice were transplanted with a mix of WT CD45.1/2+ and WT CD45.2+ bone marrow at a ratio of 1 : 10. This experimental group is depicted as WT + WT group. Shown are representative flow cytometry plots displaying the gating strategy from WT + WT group (in the left two panels). In the right four panels (in green) are shown representative plots displaying PIL cell frequencies (gated on WT CD45.1/2+) from the WT + WT group (on the left) and WT + T-MHC I group (on the right). PIL cell frequency evaluation is shown in d. e Representative flow cytometry plots of total thymocytes from Sh2d1a−/− (SAP deficient) and Sh2d1a−/− T-MHC I mice. iNKT, PIL, and Treg cell frequency are shown in f. b, d, f Each point represents one animal: n = 10 animals per group (WT and T-MHC I groups), n = 7 animals (CD1d−/− group), n = 3 animals (CD1d−/− T-MHC I group), n = 8 animals (WT + WT group), n = 9 animals (WT + T-MHC I group), n = 5 animals (Sh2d1a−/− group), and n = 6 animals (Sh2d1a−/− T-MHC I group). Data are representative of four in a, b, e, f and two in c, d independent experiments. Unpaired two-tailed Mann–Whitney test was performed in b, d and an unpaired two-tailed Student’s t-test was performed in f; ns, not significant (p ≥ 0.05), *p < 0.05, **p < 0.01, ***p < 0.001, and ****p < 0.0001. Data are presented as mean values ± SD. Source data are provided as a Source Data file.

