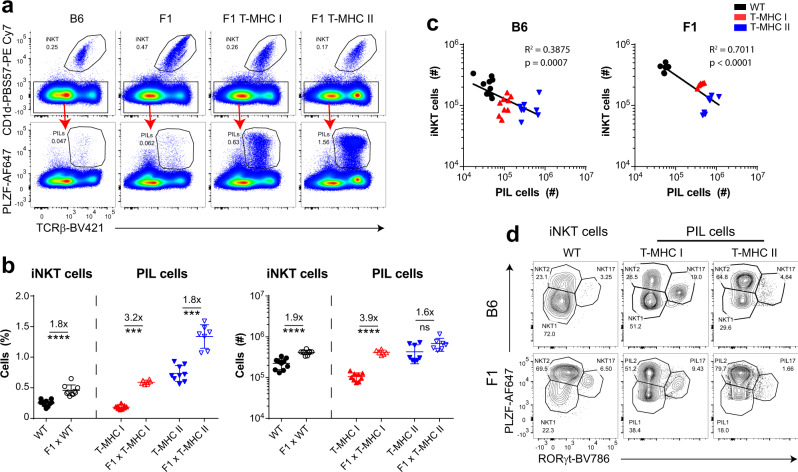
Fig. 6. PIL T cells compete with iNKT cells.
a B6 WT, T-MHC I, and T-MHC II mice were crossed to BALB/c mice and F1 generation littermates (labeled as F1, F1 T-MHC I, and F1 T-MHC II) were analyzed by flow cytometry for frequency of iNKT and PIL T cells in the thymus. b Summary evaluation of iNKT and PIL T-cell frequency (left panel) and number (right panel) from WT, T-MHC I, and T-MHC II mice on B6 and F1 background. c Inverse correlation between number of iNKT cells and the number of PIL T cells in the thymus from WT (black dots), T-MHC I (red triangles), and T-MHC II mice (blue inverse triangles) on B6 (left panel) and F1 (right panel) background. d Shown are representative flow cytometry plots comparing iNKT and PIL T-cell subsets from WT, T-MHC I, and T-MHC II mice on B6 (upper row) and F1 (lower row) background. Each point represents one animal: n = 10 animals per group (WT and T-MHC I groups), n = 8 animals (T-MHC II group), n = 9 animals (F1 WT group), n = 6 animals (F1 T-MHC I group), and n = 7 animals (F1 T-MHC II group) in a–d. Data are representative of seven independent experiments. Unpaired two-tailed Mann–Whitney test was performed in b; ns, not significant (p ≥ 0.05), ***p < 0.001, and ****p < 0.0001. R2-values and p-values in c were calculated by fitting nonlinear regression and performing a Goodness-of-Fit test and extra-sum-of-squares F test. Data are presented as mean values ± SD. Source data are provided as a Source Data file.

