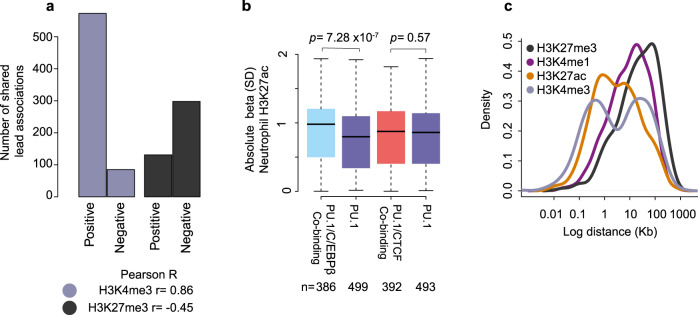
Fig. 3. Neutrophil PU.1 tfQTLs and their association with chromatin state.
a Bar plot displaying the number of shared associations (r2 ≥ 0.8) between tfQTL and histone QTL. Bar plot is split into two categories, those cases where the beta between phenotypes are positively correlated, i.e., an allele leads to a gain (an increase in signal) in both phenotypes. Or negatively correlated, where an allele associates with a gain in one phenotype and a reduction in the second phenotype. The Pearson correlation between the betas is shown beneath. b Boxplot of absolute beta for H3K27ac neutrophil QTL (no significance threshold) for proximal lead PU.1 SNPs, differentiating H3K27ac regions that are or are not marked by C/EBPβ and/or CTCF binding. Box plots show the medians (centre lines) and the 25th and 75th percentiles (box edges), with whiskers extending to 1.5 times the interquartile range. n = the number of PU.1 tfQTL that intersect H3K27ac hQTL. p value displayed above is a Welch two-sided t-test. c Density distribution plot of log distance between lead PU.1 tfQTL SNPs and shared (r2 ≥ 0.8) histone QTL in neutrophils.

