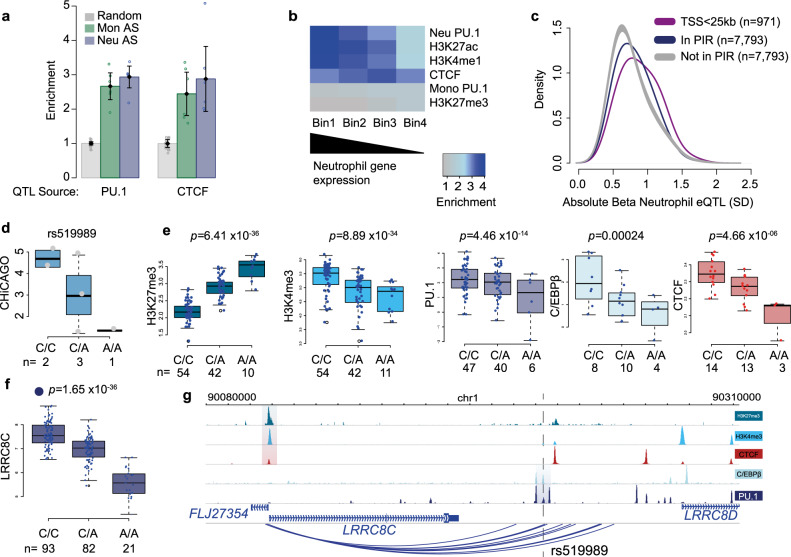
Fig. 4. tfQTLs perturb gene expression through altered chromatin state.
a Enrichment of significant tfQTLs (PU.1 and CTCF; Fisher’s exact test p < 1 × 10⁻⁵) in PIRs of both neutrophils and monocytes. The bars represent the mean and the error bars the 95% confidence interval. b Heat map showing enrichment of transcription factor or histone modified regions intersecting PIRs, whereby PIRs were ranked into four bins based on the gene expression of the connected baited genes in neutrophils. c Density plot of gene expression QTL Beta value for neutrophil PU.1 SNPs within PIRs (navy) versus distance-matched significant SNPs not in PIRs (grey) (two-sided Fisher’s exact test p < 2 × 10⁻¹⁶), and distribution of beta values for SNPs within <25 kb of transcription start site (purple). The SNPs that are not in PIRs are also significant PU.1 tfQTLs and eQTLs (linear model p < 1 × 10⁻⁵ cut off). d CHiCAGO scores for the PIR at tfQTL, segregated by donor genotype for rs519989. n the number of individual donors. e Signal box plots with donors separated by genotype for rs519989 for five molecular traits, f boxplots displaying RNA level for LRRC8C gene segregated by donor genotype for SNP rs519989. n = the number of individual donors. Box plots show the medians (centre lines) and the 25th and 75th percentiles (box edges), with whiskers extending to 1.5 times the interquartile range. p values were obtained by fitting linear mixed models implemented in LIMIX. g Genome browser view of region around LRRC8C gene, QTL regions for each molecular trait are highlighted. Dashed line depicts the location of rs519989.

