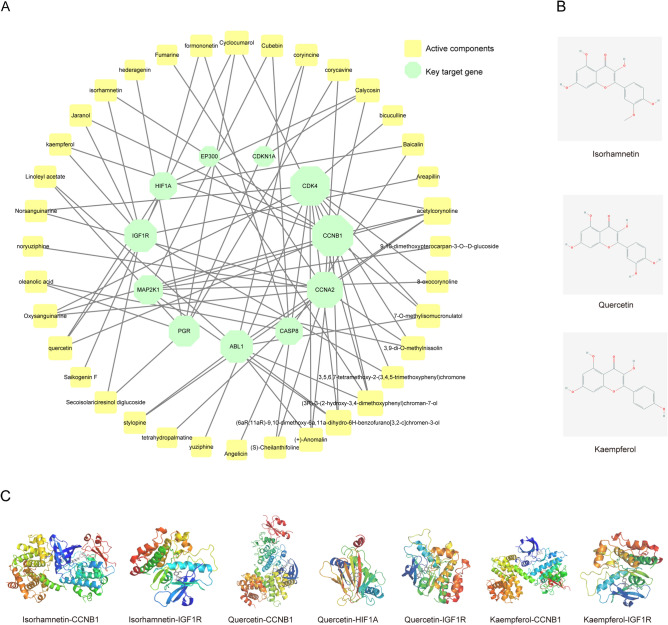
Figure 5.
The molecular docking of key compounds and key target genes. (A) Interaction network of key target genes and corresponding active compounds of prediction. The green octagons represent key target genes, the yellow squares represent active compounds of prediction. The size of the icon was set according to the degree of the network. [drawn by Cytoscape 3.8.0 (https://www.cytoscape.org/)]. (B) The structure of key compounds. (C) The molecular docking of key compounds and key target genes.

