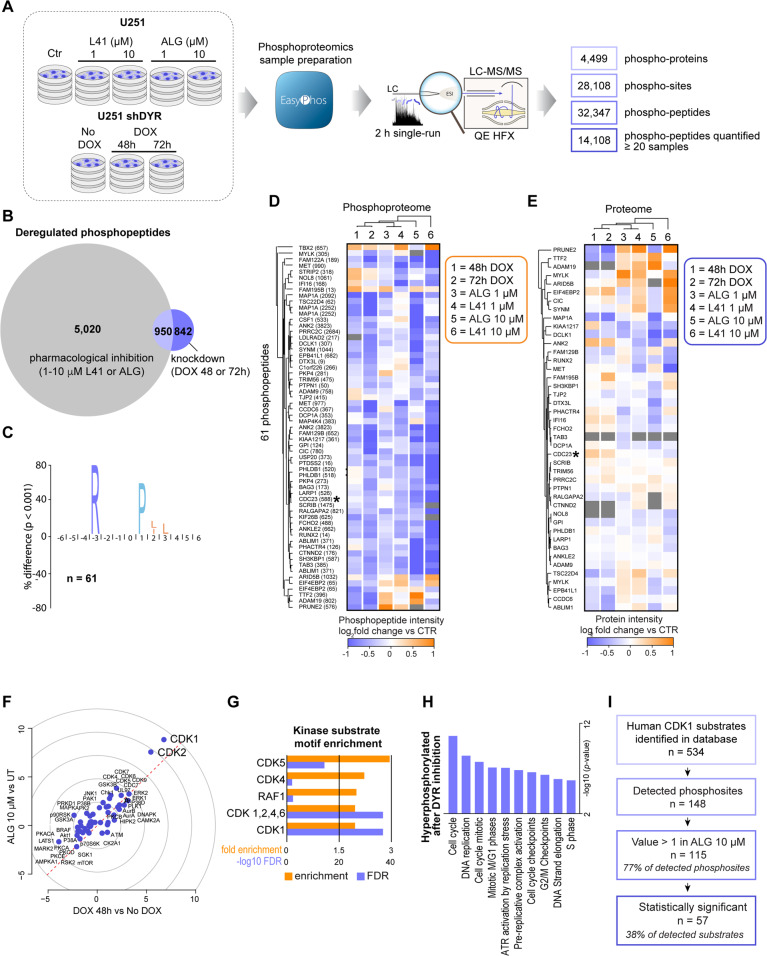
Fig. 2. Phosphoproteomic characterization of DYRK1A inhibition in U251 glioblastoma cells reveals CDK1 hyperactivity.
A Design and summary of the phosphoproteomic analysis of U251 cells treated ± DYRK1A inhibitors L41 and ALGERNON (ALG) for 72 h, and U251 shDYR cells treated ± DOX. B Venn diagram showing overlap among phosphopeptides significantly (ANOVA adj. P < 0.05 and Dunnett’s P < 0.05) reregulated by DYRK1A pharmacological inhibition (5,970 total) and genetic knockdown (1792 total). C A consensus sequence preference for DYRK1A. Motif enrichment analysis of 61 phosphopeptides regulated by both pharmacological and genetic inhibition that also possess an Arginine (R) in the –3 position, reveals a strong preference for Proline (P) in the +1 position. D Heatmap of phosphopeptide intensities (median log2 fold changes for treatment vs their respective controls) for phosphopeptides identified as potential DYRK1A substrates. E Heatmap of protein changes (median log2 fold changes of protein LFQ intensities for treatments vs their respective controls) for proteins on which phosphosites from panel D are found. F Kinase perturbation analysis with Kinase PA showing relative kinase activity in z-scores from DOX 48 h vs No DOX treatments (x-axis) and ALG (10 μM) vs untreated treatments (y-axis). G Kinase-substrate motif enrichment analysis for sites hyperphosphorylated in response to DYRK1A (DYR) inhibition. H Gene ontology over-representation analysis (Fischer’s exact test) of significantly hyperphosphorylated proteins in cells treated with ALG (10 μM, 72 h). I Annotation of CDK1 substrates (derived from PhosphoSitePlus) in the phosphoproteome of cells treated with ALG (10 μM, 72 h).

