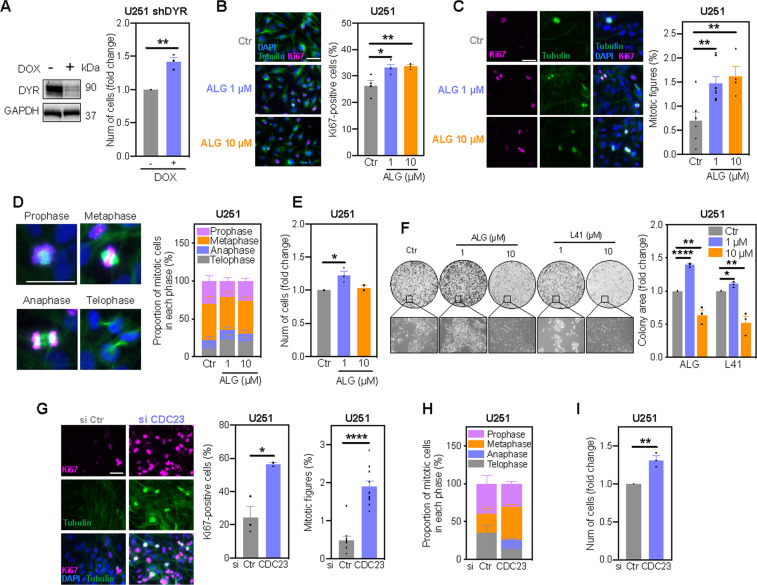
Fig. 4. DYRK1A inhibition alters proliferation of U251 glioblastoma cell in a dose-dependent manner.
A DYRK1A (DYR) expression (72 h) and nuclear staining quantification (7 days) of U251 shDYR cells treated ± DOX. Immunofluorescence images and quantification of Ki67-positive cells (B) and mitotic figures (C) in U251 cells treated with Algernon (ALG) for 7 days. Cells were stained using antibodies against Ki67 (pink) and tubulin (green). DAPI was used to visualize cell nuclei (blue). D Immunofluorescence images of mitotic phases and quantification of mitotic cells in Figure 2C for representation of each mitotic phase individually. E Nuclear staining quantification of cells treated with ALG for 7 days. F Clonogenic survival (round images), appearance (rectangle images) and quantification of colonies in cells treated with ALG and L41 for 14 days. G Immunofluorescence images and quantification of Ki67-positive cells and mitotic figures in U251 cells transfected with siRNA targeting CDC23 (7 days). Cells were stained using antibodies against Ki67 (pink) and tubulin (green). DAPI was used to visualize cell nuclei (blue). H Mitotic cells in Figure 2G were analysed for representation of each mitotic phase individually. I Nuclear staining quantification of cells transfected with siRNA targeting CDC23 (7 days). All bar graphs represent mean ± SEM of at least three independent experiments (two-tailed t-test; *P < 0.05, **P < 0.01, ***P < 0.001). Scale bars: 5 μm.

