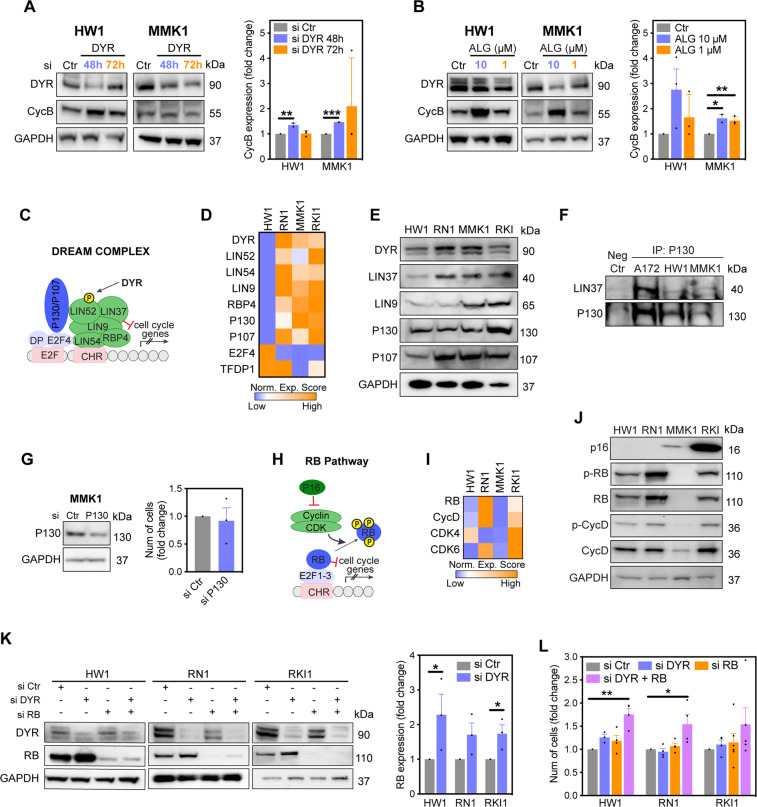
Fig. 6. Retinoblastoma expression determines the proliferative response to DYRK1A inhibition.
A, B Immunoblot analysis and densitometric quantification of cyclin B (CycB) expression in cells treated with scramble (si Ctr) and DYRK1A (si DYR) targeting siRNA (72 h), and in cells treated with DYRK1A inhibitor ALGERNON (ALG, 72 h). C Schematic overview of DREAM complex. RNA seq data showing gene expression (D) and immunoblot analysis showing protein expression (E) of DREAM complex components in glioblastoma stem cells. F Immunoblot analysis of DREAM complex assembly in glioblastoma cells. Cell lysates were first immunoprecipitated (IP) with an anti-P130 antibody, then immunoblotted against P130 and LIN37. G Immunoblot analysis of MMK1 cells transfected with P130-targeting siRNA (si P130) for 72 h and nuclear staining quantification of cells transfected with si P130 for 7 days. H Schematic overview of retinoblastoma (RB) pathway. RNA seq data (I) and immunoblot analysis (J) of RB pathway components in glioblastoma stem cells. K, M Immunoblots analysis of cells transfected with scramble (si Ctr), DYRK1A-targeting (si DYR) and RB-targeting (si RB) siRNA for 72 h. Densitometric quantification of RB expression following DYRK1A knockdown is shown. L Nuclear staining quantification of cells single transfected with si DYR or si RB, and double transfected (si DYR + RB) for 7 days. All bar graphs represent mean ± SEM from at least three independent experiments (two-tailed unpaired t-test, *P < 0.05, **P < 0.01, ***P < 0.001).

