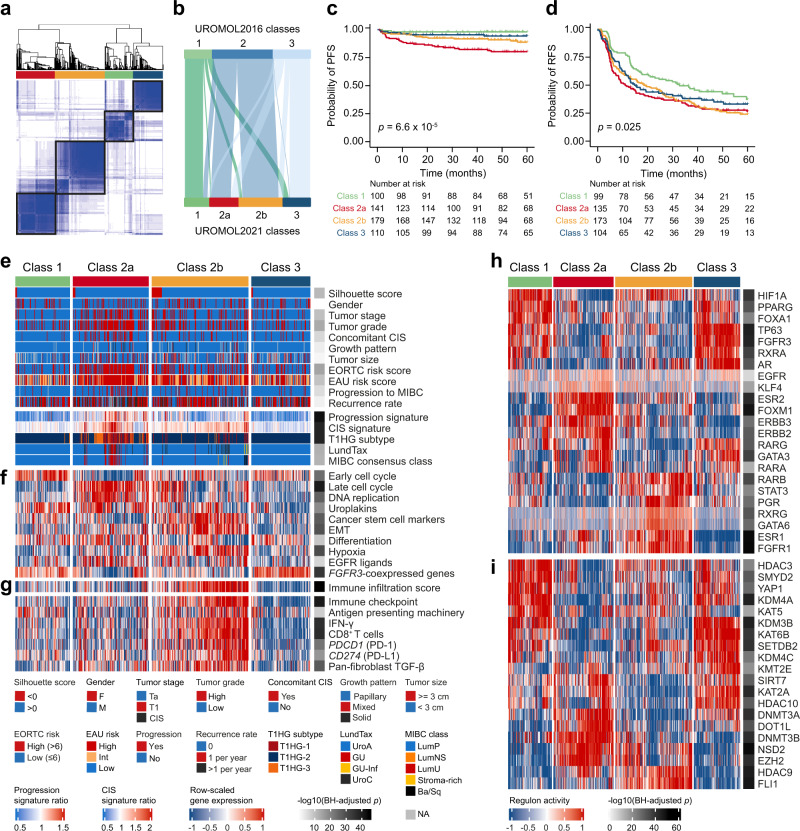
Fig. 1. Transcriptomic classes in NMIBC.
a Consensus matrix for four clusters. Samples are in both rows and columns and pairwise values range from 0 (samples never cluster together; white) to 1 (samples always cluster together; dark blue). b Comparison between the three UROMOL2016 transcriptomic classes and the UROMOL2021 four-cluster solution (76% of tumors in UROMOL2016 class 1 remained class 1, 92% of tumors in UROMOL2016 class 2 remained class 2a/2b and 67% of tumors in UROMOL2016 class 3 remained class 3). c Kaplan–Meier plot of progression-free survival (PFS) for 530 patients stratified by transcriptomic class. d Kaplan–Meier plot of recurrence-free survival (RFS) for 511 patients stratified by transcriptomic class. e, f Clinicopathological information and selected gene expression signatures for all patients stratified by transcriptomic class. Samples are ordered after increasing silhouette score within each class (lowest to highest class correlation). CIS carcinoma in situ, EORTC European Organisation for Research and Treatment of Cancer, EAU European Association of Urology, MIBC muscle-invasive bladder cancer, EMT epithelial-mesenchymal transition. g RNA-based immune score and immune-related gene expression signatures for all patients stratified by transcriptomic class. h Regulon activity profiles for 23 transcription factors. Samples are ordered after increasing silhouette score within each class (lowest to highest class correlation). Regulons (rows) are hierarchically clustered. i Regulon activity profiles for potential regulators associated with chromatin remodeling. The most-upregulated regulons within each class are shown. Regulons are hierarchically clustered. P-values were calculated using two-sided Fisher’s exact test for categorical variables, Kruskal–Wallis rank-sum test for continuous variables and two-sided log-rank test for comparing survival curves. Source data are provided as a Source data file.

