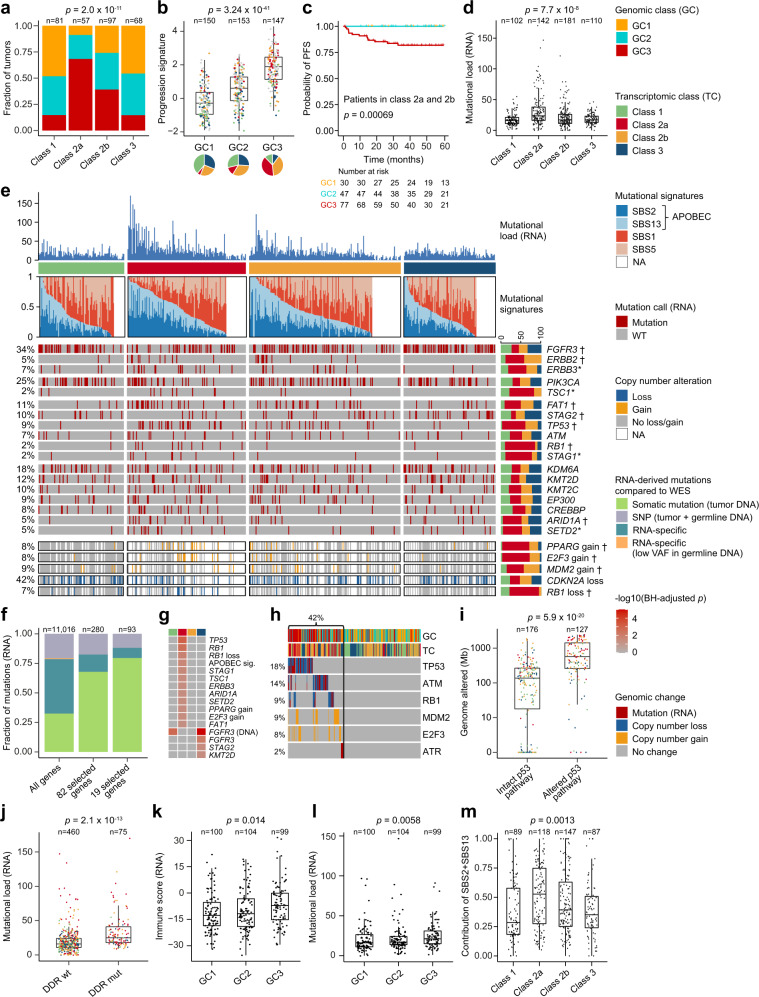
Fig. 3. Genomic alterations associated with transcriptomic classes.
a Genomic classes (GCs) compared to transcriptomic classes (n = 303). b 12-gene qPCR-based progression risk score compared to GCs. Colors indicate transcriptomic classes. c Kaplan–Meier plot of progression-free survival (PFS) for 154 patients (including only class 2a and 2b tumors) stratified by GC. d Number of RNA-derived mutations according to transcriptomic classes. e Landscape of genomic alterations according to transcriptomic classes. Samples are ordered after the combined contribution of the APOBEC-related mutational signatures. Panels: RNA-derived mutational load, relative contribution of four RNA-derived mutational signatures (inferred from 441 tumors having more than 100 single nucleotide variations), selected RNA-derived mutated genes, copy number alterations in selected disease driver genes (derived from SNP arrays). Asterisks indicate p-values below 0.05. Daggers indicate BH-adjusted p-values below 0.05. f Comparison of RNA-derived single nucleotide variations to whole-exome sequencing (WES) data from 38 patients for 11,016 mutations in all genes, 280 mutations in the genes most frequently mutated or differentially affected between the classes (n = 82, Supplementary Fig. 5b) and 93 mutations in 19 selected bladder cancer genes (Fig. 3e). Only mutations with > 10 reads in tumor and germline DNA were considered and a mutation was called observed when the frequency of the alternate allele was above 2%. g Genomic alterations significantly enriched in one transcriptomic class vs. all others. h Overview of p53 pathway alterations for all tumors with available copy number data and RNA-Seq data (n = 303). i Amount of genome altered according to p53 pathway alteration. j Number of mutations according to mutations in DNA-damage response (DDR) genes (including TP53, ATM, BRCA1, ERCC2, ATR, MDC1). k RNA-based immune score according to GCs. l RNA-derived mutational load according to GCs. m Relative contribution of the APOBEC-related mutational signatures according to transcriptomic class. P-values were calculated using two-sided Fisher’s exact test for categorical variables, Kruskal–Wallis rank-sum test for continuous variables and two-sided log-rank test for comparing survival curves. For all boxplots, the center line represents the median, box hinges represent first and third quartiles and whiskers represent ± 1.5× interquartile range. Source data are provided as a Source data file.

