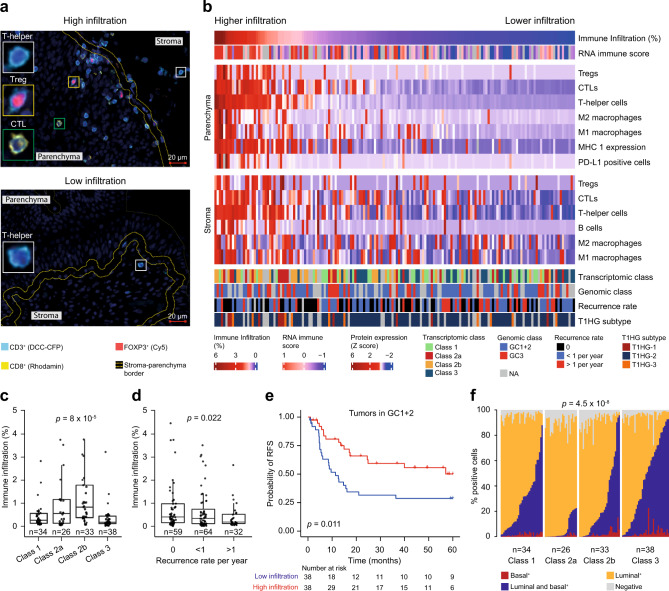
Fig. 4. Spatial proteomics analysis of tumor immune contexture.
a Multiplex immunofluorescence staining with Panel 1 (CD3, CD8, and FOXP3) of tumors with high- and low immune infiltration with magnifications of T helper cells (CD3+, CD8− and FOXP3−), a cytotoxic T lymphocyte (CTL; CD3+, CD8−, FOXP3−) and a regulatory T cell (Treg; CD3+, CD8− and FOXP3+). Yellow dashed lines divide the tumor tissue into parenchymal and stromal regions. Scale bar: 20 µm. All protein measurements were performed once for each distinct sample. b Spatial organization of immune cell infiltration and antigen recognition/escape mechanisms (MHC class 1 and PD-L1) with associated data for genomic class, transcriptomic class, and recurrence rate. The immune cells and immune evasion markers are defined as the percentage of positive cells in the different regions (stroma and parenchyma) and normalized using z-scores, (1) . Columns are sorted by the degree of immune infiltration into the tumor parenchyma in descending order from left to right. c Immune infiltration stratified by transcriptomic class. Immune infiltration is defined as the percentage of total cells in the parenchyma classified as immune cells. The p-value was calculated using two-sided Wilcoxon rank-sum test. d Immune infiltration stratified by recurrence rate. The p-value was calculated by the one-sided Jonckheere–Terpstra test for trend. e Kaplan–Meier plot of recurrence-free survival (RFS) for patients with tumors with few genomic alterations (GC1 + 2) stratified by immune infiltration. P-value was calculated using two-sided log-rank test. f Distribution of CK5/6 and GATA3 positive carcinoma cells stratified by transcriptomic class. Each column represents a patient. The p-value reflects the difference in CK5/6 expression across classes and was calculated by chi-squared test. For boxplots, the center line represents the median, box hinges represent first and third quartiles and whiskers represent ± 1.5× interquartile range. Source data are provided as a Source data file.

