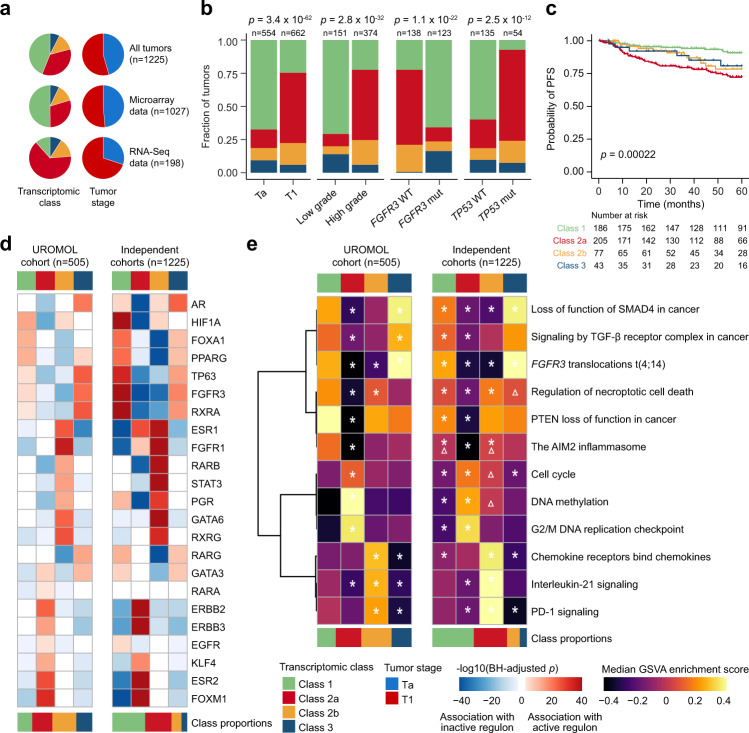
Fig. 6. Validation of transcriptomic classes in independent cohorts.
a Summary of classification results and stage distribution for all tumors, tumors with microarray data and tumors with RNA-Seq data (1228 tumors were classified in total and 1225 of these were assigned to a class). b Association of tumor stage, tumor grade and FGFR3 and TP53 mutation status with transcriptomic classes. P-values were calculated using two-sided Fisher’s exact test. c Kaplan–Meier plot of progression-free survival (PFS) for 511 patients stratified by transcriptomic class. The p-value was calculated using two-sided log-rank test. d Association of regulon activities (active vs. repressed status) with transcriptomic classes in the UROMOL cohort (including samples with positive silhouette scores, n = 505) and transcriptomic classes in the independent cohorts (pooled). The heatmap illustrates BH-adjusted p-values from two-sided Fisher’s exact tests. e Pathway enrichment scores within transcriptomic classes in the UROMOL cohort (including samples with positive silhouette scores, n = 505) and transcriptomic classes in the independent cohorts (pooled). Asterisks indicate significant association between pathway and class (one class vs. all other classes, two-sided Wilcoxon rank-sum test, BH-adjusted p-value below 0.05). Triangles indicate direction swaps of pathway enrichment in the independent cohorts compared to the UROMOL cohort. GSVA gene set variation analysis. Source data are provided as a Source data file.

