
Fig. 5. Regulation of FLP-1 secretion by mitochondrial calcium and the thioredoxin-peroxiredoxin system.
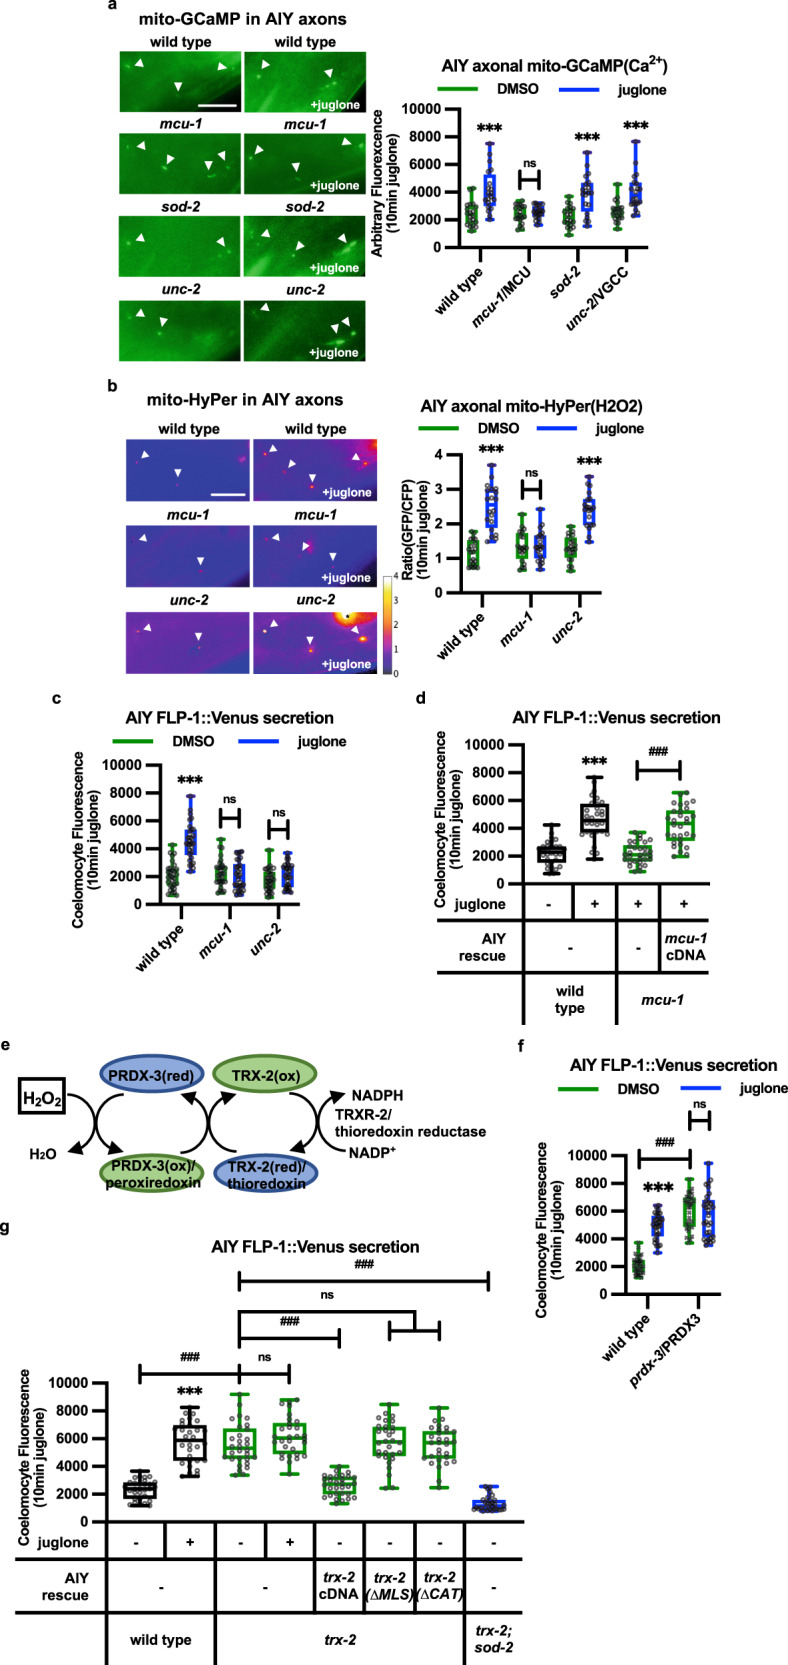
a Representative images and punctal fluorescence quantification of AIY axons from adults expressing mitochondrial-targeted GCaMP3 (mito-GCaMP) driven by the ttx-3 promoter after 10 min vehicle (DMSO) or juglone treatment. The boxes span the interquartile range, median is marked by the line and whiskers indicate the minimum and the maximum values. n = 20 biologically independent samples. ***P < 0.001, n.s not significant by Student’s two-tailed t-test. Scale bar: 10 μm. b Representative images and punctal fluorescence quantification of AIY axons from adults expressing mitochondrial-targeted HyPer (mito-HyPer) driven by the ttx-3 promoter after 10 min vehicle (DMSO) or juglone treatment. The 520 nm/480 nm (GFP/CFP) ratio of HyPer was used to measure H2O2 levels. The boxes span the interquartile range, median is marked by the line and whiskers indicate the minimum and the maximum values. n = 20 biologically independent samples. ***P < 0.001, n.s not significant by Student’s two-tailed t-test. Scale bar: 10 μm. c Quantification of average coelomocyte fluorescence intensity following exposure of the indicated mutants expressing FLP-1::Venus in AIY to juglone for 10 min. The boxes span the interquartile range, median is marked by the line and whiskers indicate the minimum and the maximum values. n = 30 biologically independent samples. ***P < 0.001, n.s not significant by Student’s two-tailed t-test. d Quantification of average coelomocyte fluorescence intensity following exposure of mcu-1 mutants expressing FLP-1::Venus in AIY to juglone for 10 min. AIY rescue denotes a transgene expressing mcu-1 cDNA under the ttx-3 promoter. The boxes span the interquartile range, median is marked by the line and whiskers indicate the minimum and the maximum values. n = 30 biologically independent samples. n = 30 biologically independent samples. ***P < 0.001, ###P < 0.001 by Student’s two-tailed t-test. e Schematic showing the redox cycle used by peroxiredoxin, thioredoxin, and thioredoxin reductase to consume H2O2. f Quantification of average coelomocyte fluorescence intensity following exposure of prdx-3/peroxiredoxin3 mutants expressing FLP-1::Venus in AIY to juglone for 10 min. The boxes span the interquartile range, median is marked by the line and whiskers indicate the minimum and the maximum values. n = 30 biologically independent samples. ***P < 0.001, n.s not significant by Student’s two-tailed t-test. ###P < 0.001 by one-way ANOVA with Dunnett’s test. g Quantification of average coelomocyte fluorescence intensity following exposure of trx-2/thioredoxin2 mutants expressing FLP-1::Venus in AIY to juglone for 10 min. AIY rescue denotes transgenes that express wild-type, mitochondrial localization signal-deleted (ΔMLS), or catalytically inactive (ΔCAT) trx-2 cDNA, under the ttx-3 promoter. The boxes span the interquartile range, median is marked by the line and whiskers indicate the minimum and the maximum values. n = 30 biologically independent samples. ***P < 0.001 by Student’s two-tailed t-test. ###P < 0.001, n.s not significant by one-way ANOVA with Dunnett’s test.