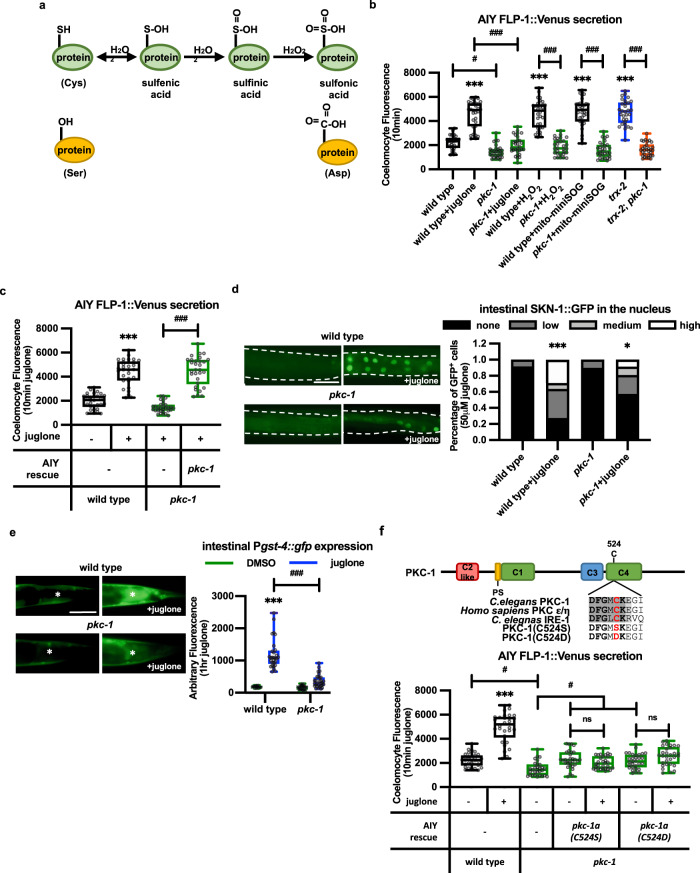
Fig. 7. mtH2O2-induced FLP-1 secretion requires C524 of PKC-1.
a Schematic representation of progressive oxidation of the sulfhydryl groups (SH) of cysteine (Cys) residues by H2O2. The cysteine to serine (Ser) substitution mimics non-oxidizable cysteine, and the cysteine to aspartic acid (Asp) substitution mimics sulfonylated cysteine. b Quantification of average coelomocyte fluorescence intensity of the indicated mutants expressing FLP-1::Venus in AIY following 10 min treatment with the indicated oxidants. The boxes span the interquartile range, median is marked by the line and whiskers indicate the minimum and the maximum values. n = 30 biologically independent samples. ***P < 0.001 by Student’s two-tailed t-test. #P < 0.05, ###P < 0.001 by one-way ANOVA with Dunnett’s test. c Quantification of average coelomocyte fluorescence intensity of pkc-1 mutants expressing FLP-1::Venus in AIY following 10 min juglone treatment. AIY rescue denotes animals expressing pkc-1a cDNA under control of the ttx-3 promoter. The boxes span the interquartile range, median is marked by the line and whiskers indicate the minimum and the maximum values. n = 30 biologically independent samples. ***P < 0.001 by Student’s two-tailed t-test. ###P < 0.001 by one-way ANOVA with Dunnett’s test. d Representative fluorescent images and quantification of the number of intestinal nuclei with SKN-1::GFP in adult animals before and after 10 min of juglone treatment. Dotted lines demarcate intestinal regions. Nuclear translocation of SKN-1::GFP was measured by counting the number of fluorescent nuclei in the intestine. Fewer than 10, between 11 and 20, and above 20 fluorescent nuclei are denoted Low, Medium, and High, respectively. n = 36, 55, 49, 47 biologically independent samples. *P < 0.05, ***P < 0.001 by Student’s two-tailed t-test. Scale bar: 100 μm. e Representative images and quantification of the posterior regions of transgenic worms expressing the oxidative stress reporter Pgst-4::gfp after 1 h of juglone treatment and 4 h of recovery. Asterisks mark the intestinal region used for quantitative analysis. Pgst-4::gfp expression in body wall muscles, which appears as fluorescence on the edge of animals in some images, was not quantified. The boxes span the interquartile range, median is marked by the line and whiskers indicate the minimum and the maximum values. n = 20, 29, 31, 31 biologically independent samples. ***P < 0.001 by Student’s two-tailed t-test. ###P < 0.001 by one-way ANOVA with Dunnett’s test. Scale bar: 50 μm. f Top: Schematic representation of the protein structure of PKC-1, showing the conserved domains (C1-C4) the pseudosubstrate domain (PS) and the putative redox active region containing cysteine 524, which is conserved in human PKCε and C. elegans IRE-1. Bottom: Quantification of average coelomocyte fluorescence intensity of the indicated mutants expressing FLP-1::Venus in AIY following 10 min treatment with juglone. AIY rescue denotes transgenes expressed under the ttx-3 promoter. The boxes span the interquartile range, median is marked by the line and whiskers indicate the minimum and the maximum values. n = 30 biologically independent samples. ***P < 0.001, n.s not significant by Student’s two-tailed t-test. #P < 0.05 by one-way ANOVA with Dunnett’s test.

