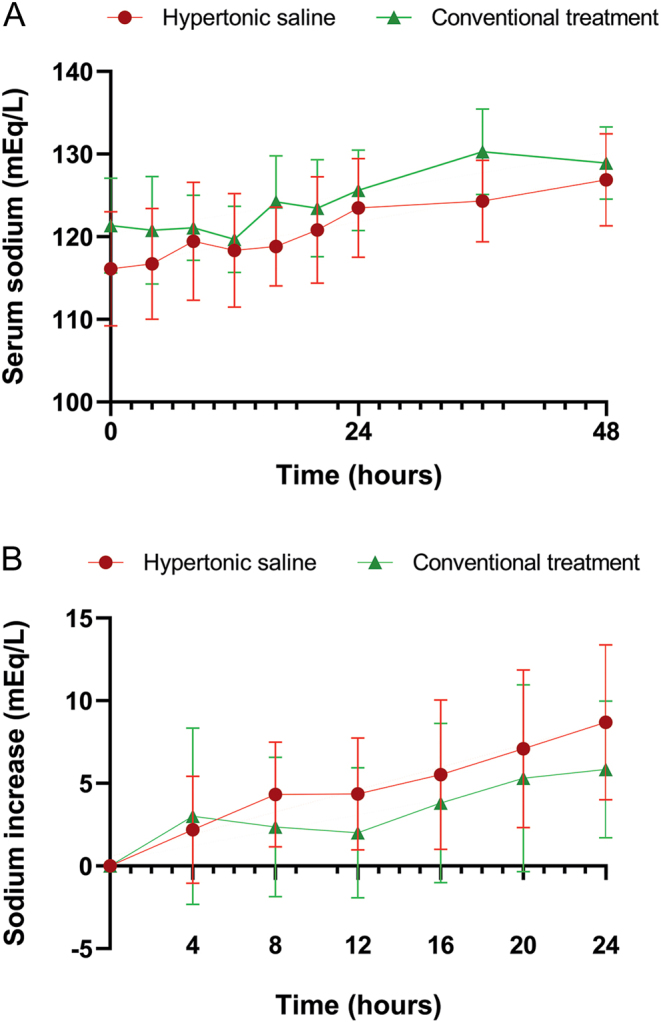
Figure 2.

Changes in serum sodium concentration in hypertonic saline group vs conventional treatment group. (A) Changes in serum sodium concentration across the first 48 h after admission. (B) Sodium increase from baseline across the first 24 h after admission.

 This work is licensed under a