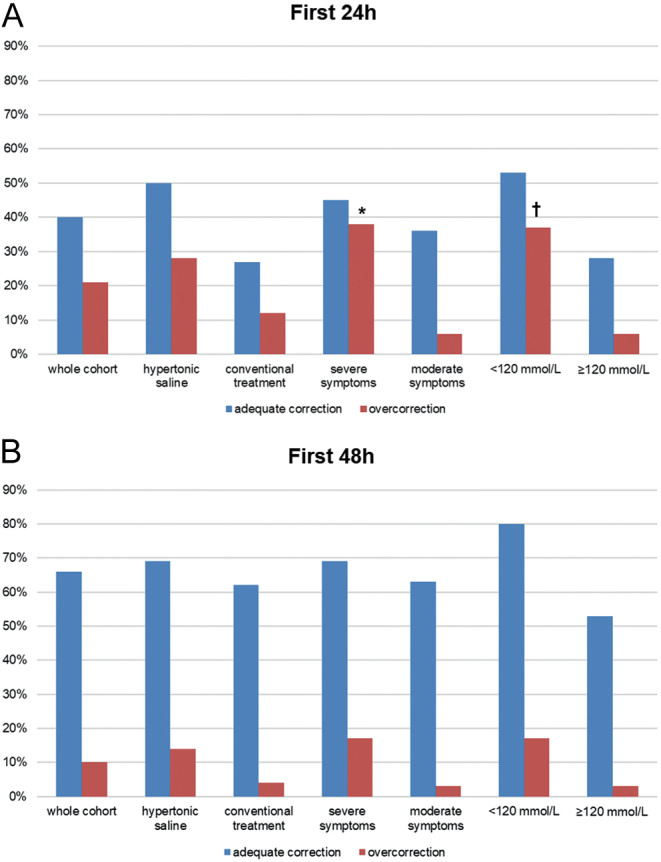
Figure 3.

Proportion of adequate correction and overcorrection of serum sodium over (A) 24 h from admission and (B) 48 h from admission in the whole cohort and in patient subgroups according to treatment, symptom severity and initial serum sodium. Fisher’s exact test, *P < 0.05 compared to moderate symptoms, †P < 0.05 compared to serum sodium ≥ 120 mEq/L at admission.

 This work is licensed under a