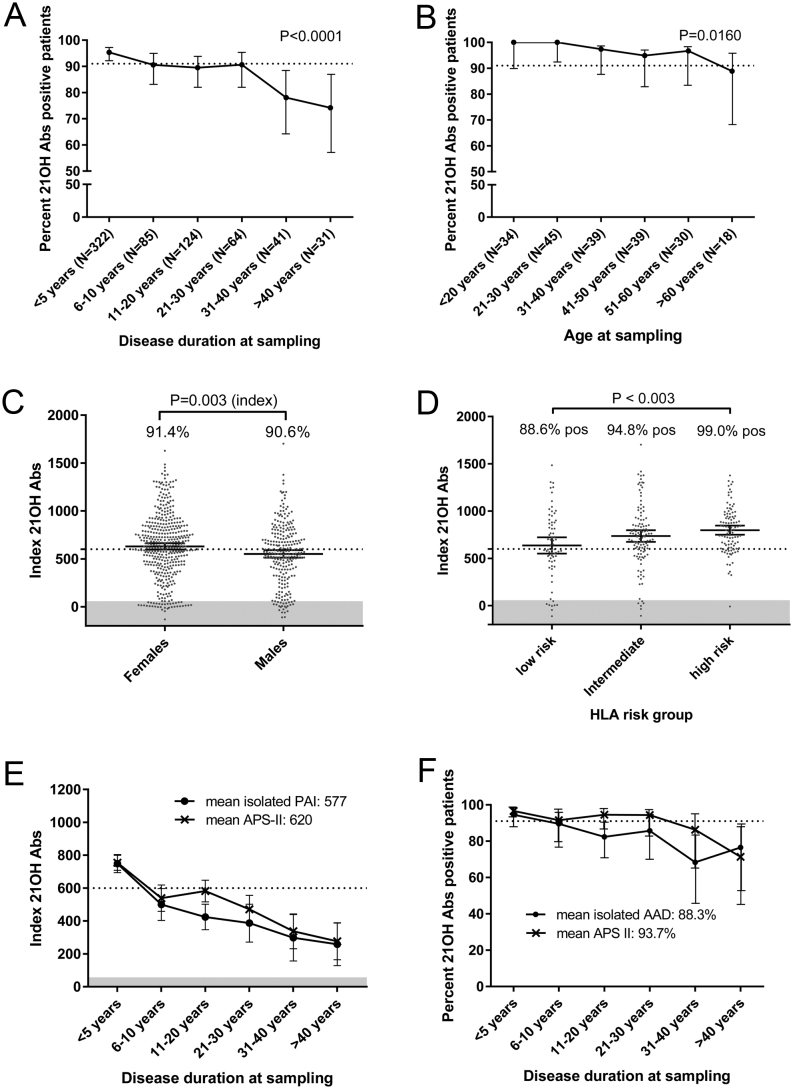
Figure 2.
Individual variables’ impact on 21OH-Abs frequency and indices (A) Percentage of isolated PAI and APS-II patients positive for antibodies against 21OH (21OH-Abs) separated in groups according to disease duration at sampling. The statistical test was done with logistic regression analysis. (B) Percentage of isolated PAI and APS-II patients positive for 21OH-Abs sampled within 1 year of diagnosis in relation to age at diagnosis. Statistical analysis was done with logistic regression analysis. (C) 21OH-Abs-indicies in males and females. Percentage positive for each sex is shown inside the corresponding box. Statistical test for indices between the groups was achieved by a parametric t-test while statistical differences between the frequencies were done by a Pearson’s chi test. (D) 21OH-Abs indices stratified by HLA-risk groups given in Table 2 and percentage positives in each group. Statistical differences were calculated by ANOVA and Tukey’s test. (E) 21OH-Abs-indices stratified into phenotypic groups and disease duration at sampling; isolated PAI (black) and APS-II (red). (F) Percent positive for 21OH-Abs stratified to disease duration at sampling; isolated PAI (black) and APS-II (red). The dashed line (A, B and F) represents the mean positivity for autoantibodies against 21OH-Abs in the whole isolated, AAD autoimmune PAI and APS-II cohort. The dashed line (C and E) represents the mean indices of 21OH-Abs. The shaded area (C–E) in the lower part of the graph represent where the test gives negative results (sets the threshold for positivity). 95% CI is shown by vertical bars.

 This work is licensed under a