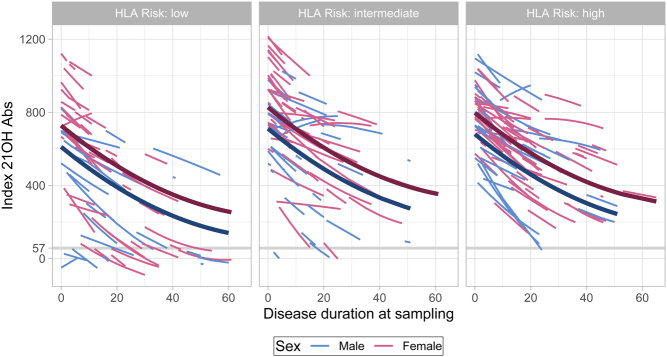
Figure 3.
Estimated individual trajectories from mixed-effects longitudinal regression model for 21OH-Abs (n = 1287 observations from 277 individuals). The lines corresponds to individual patients. Includes data from patients with at least two samples. The thick lines show the predicted trajectory for a ‘typical’ patient (all random effects set to 0), that is a 40-year-old female with APS-II.

 This work is licensed under a