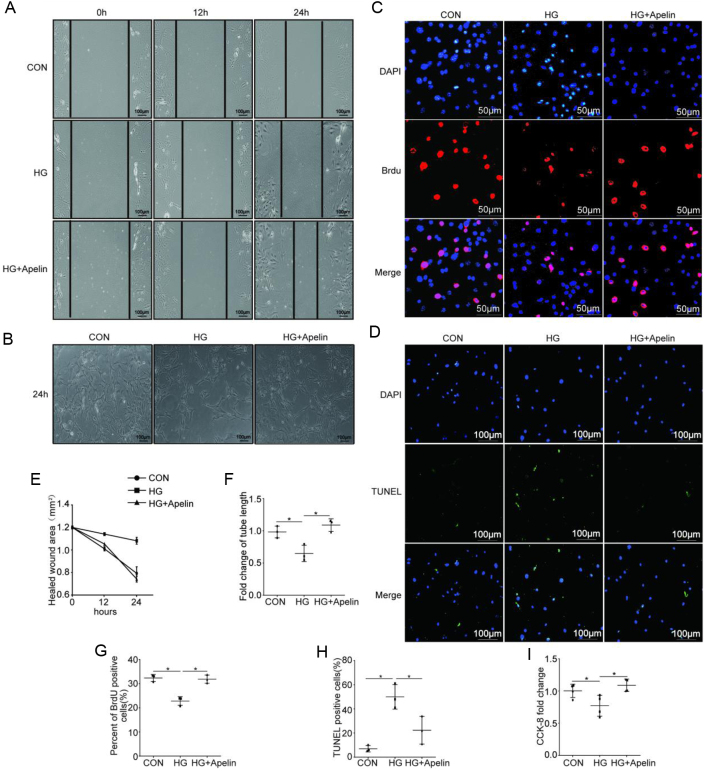
Figure 6.
Apelin improved endothelial dysfunction in high-glucose environment. (A) Representative images of wound healing assay as quantified in (E). Scale bars represent 100 μm. (B) Representative images of Matrigel assay as quantified in (F) (n = 3, *P < 0.05). Scale bars represent 100 μm. (C) Representative images of the incorporation of BrdU as quantified in (G) (n = 3, *P < 0.05). Scale bars represent 50 μm. (D) Representative images of TUNEL assay as quantified in (H) (n = 3, *P < 0.05). Scale bars represent 100 μm. (I) Quantification of CCK-8 assay. n = 3, *P < 0.05.

 This work is licensed under a