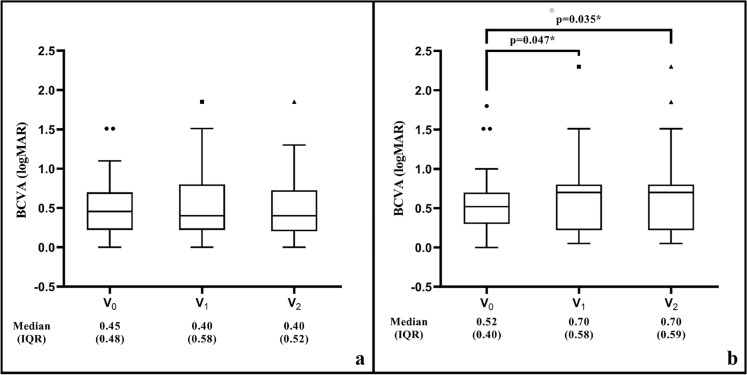
Fig. 4.
Box-plot graphic showing the change in BCVA in the study period in Group 1a (a) and Group 2a (b). BCVA best-corrected visual acuity, IQR interquartile range, logMAR logarithm of the minimum angle of resolution, V0 the last visit before the restriction period where the IVI at restriction period scheduled, V1 the first visit after the restriction period ends, V2 the last follow-up visit within six months after the restriction period ends. *Wilcoxon signed-rank test

