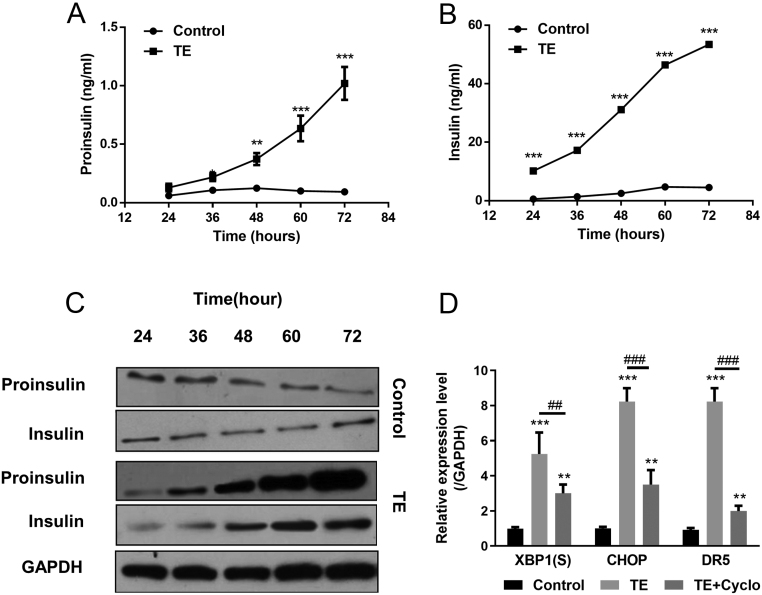
Figure 4.
TE-induced ER stress by sustained insulin overexpression. (A and B) INS-1 cells were treated with 0.1 μg/mL TE, and culture media were collected to measure proinsulin (A) and insulin (B) content by ELISA at each time point. (C) Cells were harvested, and proinsulin, insulin were tested by Western blot. (D) INS-1 cells were treated with 0. 1 μg/mL TE without or with Cyclo (cycloheximide 0.1 μmol/L). Levels of XBP1(S), CHOP and DR5 mRNA in INS-1 cells were measured by real-time PCR and normalized against GAPDH. Values represent means ± s.d. **P < 0.01, ***P < 0.001 compared with control. ##P < 0.01, ###P < 0.001.

 This work is licensed under a