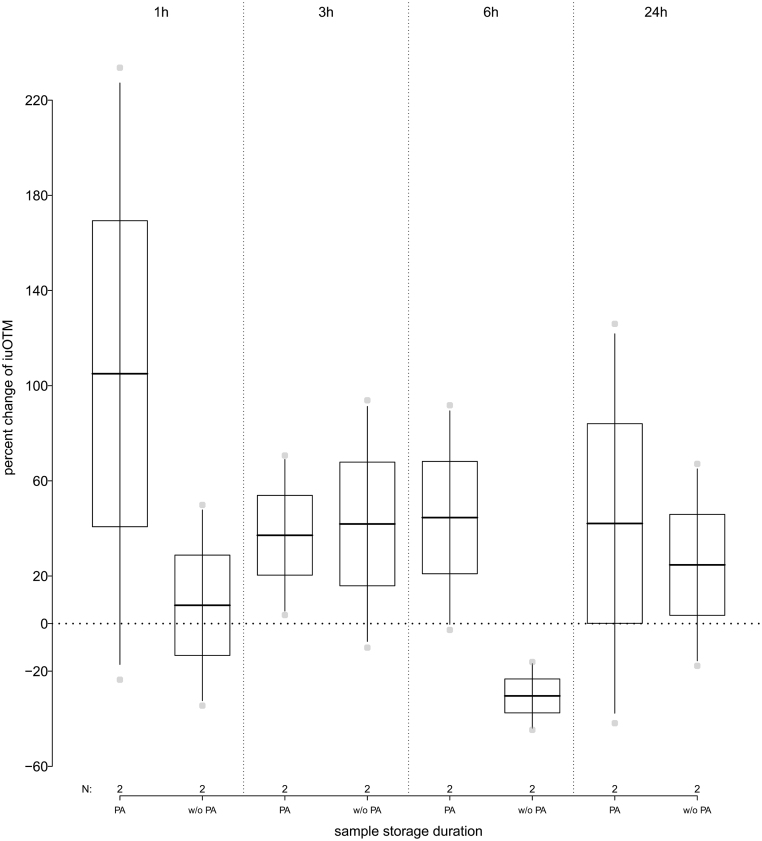
Figure 3.
Percent change in immunoreactive urinary oxytocin metabolite (iuOTM) levels of human urine pool samples (n = 2) stored at 4°C for 1, 3, 6 and 24 h; separated by samples to which phosphoric acid (PA) was added or not (w/o PA). The horizontal line indicates the 100% control iuOTM levels, for pooled samples that have been frozen immediately following collection.

 This work is licensed under a