Abstract
Transthoracic echocardiography is the first-line imaging modality in the assessment of right-sided valve disease. The principle objectives of the echocardiographic study are to determine the aetiology, mechanism and severity of valvular dysfunction, as well as consequences on right heart remodelling and estimations of pulmonary artery pressure. Echocardiographic data must be integrated with symptoms, to inform optimal timing and technique of interventions. The most common tricuspid valve abnormality is regurgitation secondary to annular dilatation in the context of atrial fibrillation or left-sided heart disease. Significant pulmonary valve disease is most commonly seen in congenital heart abnormalities. The aetiology and mechanism of tricuspid and pulmonary valve disease can usually be identified by 2D assessment of leaflet morphology and motion. Colour flow and spectral Doppler are required for assessment of severity, which must integrate data from multiple imaging planes and modalities. Transoesophageal echo is used when transthoracic data is incomplete, although the anterior position of the right heart means that transthoracic imaging is often superior. Three-dimensional echocardiography is a pivotal tool for accurate quantification of right ventricular volumes and regurgitant lesion severity, anatomical characterisation of valve morphology and remodelling pattern, and procedural guidance for catheter-based interventions. Exercise echocardiography may be used to elucidate symptom status and demonstrate functional reserve. Cardiac magnetic resonance and CT should be considered for complimentary data including right ventricular volume quantification, and precise cardiac and extracardiac anatomy. This British Society of Echocardiography guideline aims to give practical advice on the standardised acquisition and interpretation of echocardiographic data relating to the pulmonary and tricuspid valves.
Keywords: echocardiography, guideline, pulmonary valve, tricuspid valve
Introduction
Guidance for the echocardiographic assessment of the right side of the heart has historically been lacking when compared to the left heart. The British Society of Echocardiography (BSE) has recently published guidelines for the echocardiographic assessment of the right heart in adults (1). Whilst the aforementioned document included assessment of the tricuspid valve (TV) and pulmonary valve (PV), it primarily focused on right ventricular (RV) dimensions and function. In recent years, the TV and PV have received greater scientific attention, in part due to the advent of percutaneous right heart interventions. Widespread adoption of three-dimensional echocardiography (3DE) has seen its use extended more routinely to the right heart. This has allowed for more accurate quantification of RV morphology and dimensions than has previously been possible using conventional two-dimensional (2D/2DE) and Doppler echocardiography. Advances in echocardiographic techniques have allowed novel insights into the mechanisms of valve disease and the progression of pathological processes such as secondary tricuspid regurgitation (TR), and improved quantification of valve disease severity. Concomitantly, longitudinal outcome data have consistently demonstrated that disease processes such as secondary TR are independently associated with a poor outcome (2, 3). Greater attention to the right-sided heart valves is therefore necessary, and refinement and validation of echocardiographic techniques for their assessment is timely. It was, therefore, the consensus of the BSE Education Committee that a separate guideline dedicated to the assessment of the TV and PV in adults was required.
This guideline document aims to provide the reader with a theoretical background to the pathological processes involved in right-sided valve disease, and their consequences on cardiac remodelling. It also aims to serve as a didactic, hands-on guide for echocardiography practitioners, including practical advice on image acquisition and optimisation, as well as up-to-date reference values for valve disease quantification. Whilst this will include guidance on grading of severity, we have not attempted to summarise thresholds for surgical intervention, for which the reader is referred to published international guidance on the management of valve diseases (4, 5). We have also not attempted to comprehensively characterise congenital diseases affecting the right heart. Rather, the focus is on generic principles and practical techniques applicable in a range of different pathologies. Finally, it is beyond the scope of the present document to provide a detailed account of the use of echocardiography for the guidance of percutaneous structural right heart interventions.
General principles and terminology
Valvular defects may broadly be classified as primary, where there is inherent pathology of the valve apparatus itself, or secondary (also known as functional), where a structurally normal valve is distorted by anatomical changes in the right atrium (RA), RV or outflow tract (RVOT), tricuspid valve annulus (TVA), or pulmonary artery (PA). Primary TV or PV lesions may be either congenital or acquired. Pure primary valve disease will in theory, at least initially, be characterised by a normal RV and RA. In reality, however, for example in primary TR, the RV will progressively remodel, leading to the development of additional secondary TR.
Echocardiographic assessment of any valve lesion involves a multi-parametric approach which includes 2D and 3D imaging, colour flow mode (CFM) and spectral Doppler, and should involve imaging from multiple acoustic windows. In all cases, decisions regarding lesion severity should not rely on information from any single view or modality. Qualitative data (e.g. leaflet motion pattern) should be integrated with semi-quantitative measures (e.g. colour flow jet size) and quantitative measures (e.g. calculated valve area or regurgitant orifice). However, it must be acknowledged that even quantitative measures of valvular dysfunction can have differing implications according to the specific aetiology, patient body size, ventricular compliance and function, degree of chronicity, and loading conditions at the time of assessment (6).
Normal anatomy of the tricuspid and pulmonary valves
Tricuspid valve
The TV is the largest and most apically located valve in the heart. The normal TV orifice area is 7–9 cm2, which results in a low-pressure gradient between the RA and RV (<2 mmHg). The TV consists of an annulus, leaflets, papillary muscles, and chordae tendinae.
The TVA is a D-shaped ellipsoid which has a saddle-shaped rather than planar profile. The superior portion of this saddle is located near the aortic valve and RVOT, whilst the inferior portion is near the coronary sinus (CS). The normal TVA area, circumference, long axis and short axis diameters, respectively, at end-diastole are 8.6 ± 2.0 cm2, 10.5 ± 1.2 cm, 36 ± 4 mm and 30 ± 4 mm by 3DE (7). Annular area, however, changes by approximately 30% during the cardiac cycle, being largest at end-diastole (8). The straight segment of the D-shape overlies the ventricular septum and forms the base of the septal leaflet of the TV. The remainder of the annulus is relatively unsupported by the free lateral and posterior RV walls.
Using transthoracic echocardiography (TTE), the TV is typically imaged in the parasternal long axis (PLAX) RV inflow view (by tilting the probe inferiorly from the conventional PLAX window), in the parasternal short axis (PSAX) view, as well as the apical four-chamber (A4C) view. However, quantification of TV and RV dimensions should be performed using the RV-focused A4C view. In order to obtain this view, the transducer may need to be moved slightly laterally from the conventional A4C position in order to bring the RV into the centre of the image, whilst ensuring that the LV outflow tract does not come into view, and that the LV apex remains central to the top of the image sector. The probe is then rotated to obtain the maximum RV basal diameter (1).
There are usually three TV leaflets of unequal size. All three leaflets cannot usually be imaged in a single echocardiographic view, and there is high variability in which leaflet is seen in any particular imaging plane (Figs 1 and 2). The anterior leaflet extends from the RV infundibulum anteriorly to the inferolateral wall posteriorly, and is usually the largest and most mobile. The posterior leaflet attaches along the posterior margin of the TVA from the septum to the inferolateral wall, is the shortest circumferentially, and often exhibits several scallops. It is not clearly demarcated from the anterior leaflet in 10% of individuals. The septal leaflet extends from the interventricular septum to the posterior RV. It is the shortest radially and is the least mobile. The commissure between the septal and posterior leaflets is usually located near the entrance of the CS into the RA. The commissure between the septal and anterior leaflets is typically the largest and is found near the non-coronary sinus of Valsalva. During interventional procedures, devices anchored in this region therefore risk aortic perforation. The right coronary artery, AV node and bundle of His are located close to the anterior leaflet, hence pressure on this area during invasive procedures may result in heart blocks. Coaptation of the TV usually takes place just below (i.e. just on the ventricular aspect) of the TVA. The normal coaptation length is 4–9 mm, which creates some coaptation reserve in case of annular dilatation (6).
Figure 1.
Transthoracic PLAX RV inflow imaging planes through the TV (9). If the interventricular septum and CS can be seen, the image will most likely demonstrate the septal ± anterior leaflets of the TV (panel A). If the septum and CS are not seen, it is likely to be the anterior and posterior leaflets that are imaged (panel B). Panel B also demonstrates the anatomical relationship between the TV and the anterior and inferior walls of the RV, the liver and the diaphragm. A indicates anterior leaflet of the TV; CS, coronary sinus; IVC, inferior vena cava; P, posterior TV leaflet; S, septal TV leaflet.
Figure 2.
Transthoracic apical 4-chamber and 5-chamber views of the TV(9). If the LV outflow tract is visible, the septal and anterior TV leaflets are likely to be in view (panel A). If the LVOT and CS are not seen, the septal and anterior or posterior TV leaflets are most likely to be visualised (panel B). If the CS is in view, the septal and posterior TV leaflets are likely to be imaged (line C). A indicates anterior TV leaflet; P, posterior TV leaflet; S, septal TV leaflet.
The TV tensor apparatus consists of an anterior, a posterior, and in most cases (80%) septal papillary muscle (PM), as well as the associated chordae. The large anterior PM arises from the lateral RV wall and supports the anterior and posterior TV leaflets. The moderator band may join the anterior PM. The posterior PM supports the posterior and septal leaflets. Any displacement of the RV free wall or septum, as seen for example in cavity dilatation or bundle branch blocks, therefore has the potential to promote TR by altering subvalvar geometry. Chordae arise from the PMs and also directly from the ventricular septum, attaching to the anterior and septal leaflets. There are usually around 25 chordae, which present a potential source of entrapment for intracardiac devices during percutaneous therapies. The TV chordae are in general less distensible than those of the mitral valve, which means that leaflet tethering easily occurs as a result of RV dilatation.
Pulmonary valve
The PV is a tricuspid structure which is anatomically very similar to the aortic valve. The cusps are, however, thinner, in view of the lower right-sided pressures. The PV arises from the muscular RV infundibulum and lacks fibrous continuity with the TV, unlike the mitral-aortic continuity. The PV is imaged by TTE from the PSAX view or from the modified, superiorly tilted PLAX window. The subcostal window may also add information when parasternal views are inadequate. Echocardiographic visualisation of the PV is typically more difficult than for other valves, and usually only one or two cusps will be visualised simultaneously. It is sometimes possible to obtain a good quality 3DE dataset of the PV using either TTE or transoesophageal echocardiography (TOE).
Causes of right-sided valve pathology
Tricuspid valve disease
Physiological TR in the context of a structurally normal valve, with a non-dilated RV and RA, is seen in the majority of normal individuals. It is characterised by a narrow, laminar jet in a small region close to the valve closure line.
Primary disorders of the TV apparatus include congenital conditions such as Ebstein anomaly, and TV dysplasia. Ebstein anomaly involves apical and superior displacement of the TV, with atrialisation of the remainder of the RV. There is usually a large anterior leaflet, tethered septal leaflet, and significant, progressive TR. Acquired causes of primary TV disease include blunt chest trauma, rheumatic fever, endocarditis, myxomatous degeneration, carcinoid, radiation-induced valve thickening, and certain serotonergic drugs (e.g. high-dose cabergoline, and pergolide) (10). Intracardiac devices such as catheters and endomyocardial biopsy needles can entangle the TV chordae, impinge on, or perforate leaflets. Pacemaker and defibrillator lead-associated TR is an increasingly recognised phenomenon, with a variety of possible mechanisms (11). The predominant mechanism is probably direct, lead-associated disruption of TV coaptation, or damage to the leaflets or subvalvar apparatus (Fig. 3). Iatrogenic causes of TV disease have become more relevant with the growth of percutaneous therapies for the right-sided heart valves. The aetiology of primary TV disease can usually be elucidated by identifying characteristic morphological changes on 2D, and particularly 3D, echocardiography. Carcinoid TV disease, for example, typically results in thickened leaflets with reduced motion in the absence of commissural fusion (12). Rheumatic TV disease is characterised by commissural fusion, shortening and retraction of leaflets and chordae, and leaflet calcification, resulting in tricuspid stenosis (TS) and/or TR which is almost always seen concomitantly with rheumatic mitral valve disease (10).
Figure 3.
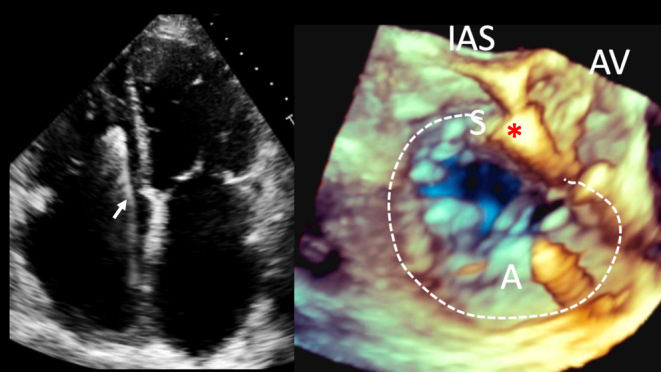
Pacemaker lead-associated TR. Left image, 2D A4C view. An RV pacing lead can be seen crossing the TV (white arrow). Right image, TOE 3D live zoom image of the RA en face view of the TV. As the leaflets of the TV close in systole, the septal leaflet appears tethered and fixed to the pacing lead, with a large coaptation defect, with resultant severe TR. White dotted line, TV annulus; IAS, interatrial septum position; AV, aortic valve; A and S, anterior and septal TV leaflets.
Secondary TV disease occurs when a structurally normal valve is disrupted by remodelling of the RV and/or RA. This includes some congenital conditions, for example TV leaflet tethering associated with ventricular septal defects or patches used to close them, causing secondary TR. Right ventricular pacing may promote TR by altering the normal cardiac contraction pattern and creating mechanical dyssynchrony (11). This might in theory be ameliorated by minimising RV pacing, biventricular pacing, or RV septal lead positioning, although the evidence for this is lacking. Secondary TR is also common in conditions of RV volume overload including left-to-right shunts and pulmonary regurgitation (PR), as well as intrinsic RV myocardial diseases such as arrhythmogenic cardiomyopathy and RV infarction (13).
It has become clear from the most recent literature that dilation of the RA, particularly in the setting of persistent atrial fibrillation, is one of the most frequent mechanisms of functional TR (‘atriogenic functional TR’) (14, 15, 16). As the TVA dilates, it loses its saddle shape, becomes more planar, and loses its sphincter function. Here the RV may be non-dilated, with normal papillary muscle geometry and no evidence of leaflet tethering or tenting. Atriogenic functional TR is to be distinguished from ‘ventricular functional TR’, where there is RV remodelling due to pulmonary hypertension (PH), most commonly in the context of left-sided heart disease. In such cases, there is less TVA dilation, and more leaflet tethering than in atriogenic TR. Approximately 30% of patients with mitral valve disease have significant concomitant TR due to the development of post-capillary PH (9).
In secondary TR, therefore, the dimensions of the TVA, RV and RA, and the extent of tricuspid leaflet tethering are the key determinants of regurgitation severity (15). TR itself leads to progressive RV and RA remodelling, which in turn perpetuates TVA dilatation, papillary muscle displacement, and further leaflet tethering (‘TR begets TR’). RV volume overload leads to interventricular septal shift, reducing LV cavity size and impairing LV filling, further exacerbating PH. There is evidence that PH and RV impairment in this setting may not improve after left-sided valve surgery has reduced the RV afterload (17, 18). Current guidelines, therefore, advocate liberal use of undersized TV annuloplasty at the time of left-sided heart valve surgery, even for non-severe TR, particularly when the TVA is dilated (5). In some studies, the presence of AF and/or PH have been the strongest predictors of progressive secondary TR (3). Other studies have revealed late, progressive TR in around a quarter of patients who had previously undergone left-sided heart valve surgery, with pre-operative AF being the strongest risk factor (2). Current guidelines advocate consideration of surgical intervention for isolated secondary TR after previous left-sided surgery, in symptomatic patients or those with progressive RV dysfunction, provided that severe LV or RV impairment, or severe PH, have not already developed (5). In addition, percutaneous TV interventions are rapidly evolving to address this problem in patients that do not meet these criteria (e.g. those with severe ventricular dysfunction) (9).
Pulmonary valve disease
A trace of PR is present on echocardiography in up to 75% of normal subjects (6). Severe PR in adults is most commonly seen in repaired congenital heart disease, for example previous valvotomy or valvuloplasty for pulmonary stenosis (PS) and pulmonary atresia, and repaired tetralogy of Fallot. Acquired mild or moderate PR is most frequently seen in patients with pulmonary arterial dilatation as a consequence of PH. Isolated valvular PS is seen in both children and adults and can be associated with syndromes, for example, Noonan syndrome. Residual degrees of subvalvular, valvular and supravalvular PS can be seen in repaired tetralogy of Fallot. Other, less common causes of acquired PS and/or PR include native or prosthetic PV endocarditis, blunt chest trauma, endocarditis, carcinoid, myxomatous degeneration, rheumatic heart disease, and drug-induced causes (e.g. pergolide).
Assessment of severity of tricuspid and pulmonary valve disease
TV and PV lesions should be graded according to severity in a similar way to left-sided lesions, using a multimodal approach, with both quantitative and qualitative techniques (Tables 1, 2 and Supplementary data, see section on supplementary materials given at the end of this article). It is important to minimise observer variability, therefore a standardised approach is required. It is also important that the operator is aware of the inherent limitations of each technique.
Table 1.
Transthoracic echocardiography for the assessment of the tricuspid and pulmonary valves.
| View (modality) | Measurement | Explanatory notes | Image |
|---|---|---|---|
| PLAX RV inflow (2D) | Qualitative inspection of the TV. The leaflet to the right of the image sector is usually the anterior leaflet. The image to the left of the sector may be the septal or posterior leaflet. | 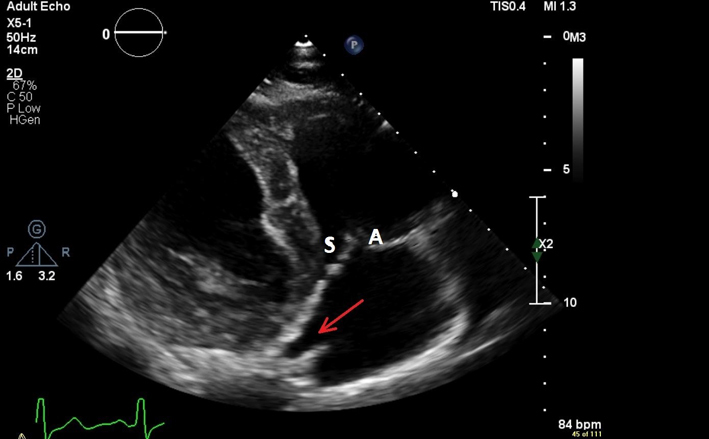 |
|
| Note any leaflet thickening or calcification, prolapse or flail segments, large coaptation defect or vegetation. | |||
| Figure 1 for illustration of different cut planes through the TV leaflets from this window. | |||
| Variable view (3D imaging) | 3D live zoom images of the TV. The left image shows the RV en face view. The right image shows the RA en face view. The key landmarks are also shown. A, anterior TV leaflet; AV, aortic valve; AVN, atrioventricular node; CS, coronary sinus; LVOT, left ventricular outflow tract; P, posterior TV leaflet; RVOT, right ventricular outflow tract; S, septal TV leaflet |
 |
|
|
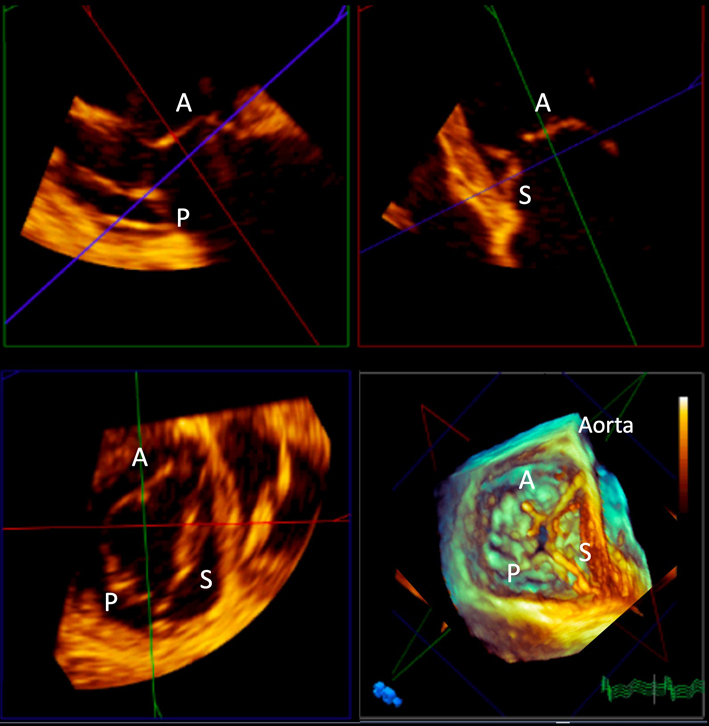
TVA area TVA perimeter TV tenting height TV tenting volume |
3D live zoom dataset acquired from the TTE parasternal tricuspid valve inflow view. Multi-plane reconstruction software allows rapid segmental analysis of the valve leaflets and associated landmarks. Normal 8.6 ± 2.0 cm2 Normal 10.5 ± 1.2 cm A tenting height >0.76 cm is predictive of significant residual TR after TV surgery (62). 3DE TV tenting volume ≥ 2.3 mL predicts severe residual TR after TV annuloplasty for functional TR (63). |
 |
|
| PLAX RV inflow (CFM) | Assessment of TR severity | 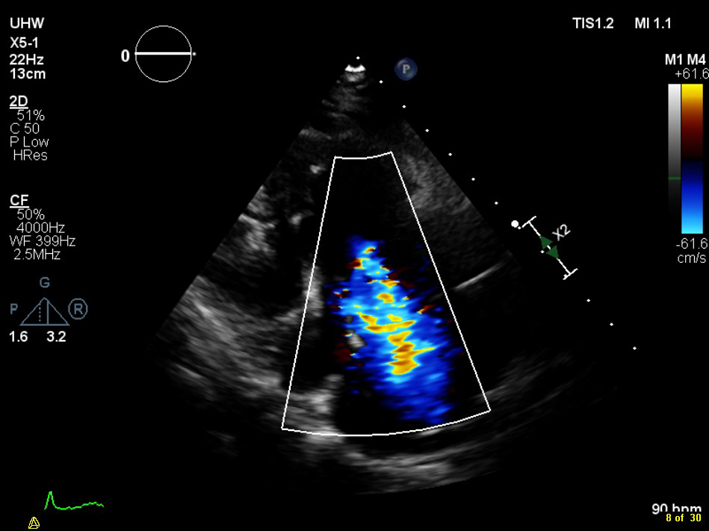 |
|
| VC width | See ‘A4C (CFM)’ for details | ||
| Variable view (3D CFM imaging) | See ‘A4C (CFM)’ for details of 2D VC assessment. | 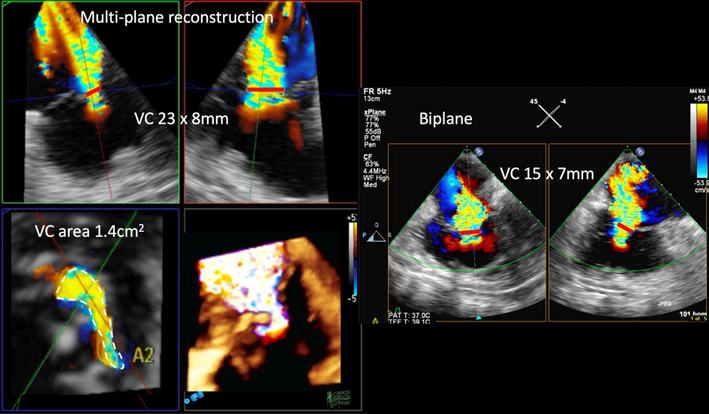 |
|
| Multiplane reconstruction of the live 3D colour Doppler dataset allows precise quantification of the VC through optimal alignment with its long and short axis, as well as tracing the VC area at this level. | |||
| Red lines depict the level of the vena contracta in each view. | |||
| VC area | By 3D echo, VC area >0.4 cm2 is consistent with severe TR (48, 49). | ||
| PLAX RV inflow (CW) | TR Vmax | See A4C CW for details. | 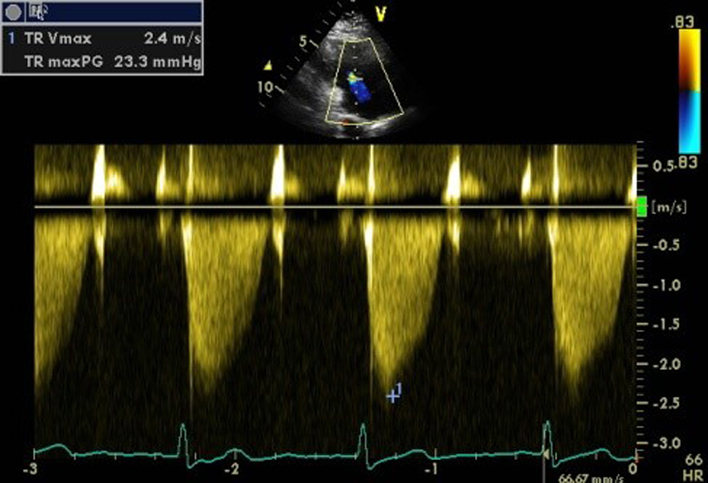 |
| PSAX TV (2D) | Qualitative inspection of the TV leaflets. The leaflet adjacent to the aorta is either the septal or anterior leaflet. The leaflet adjacent to the RV free wall is usually the posterior leaflet. |  |
|
| PSAX RVOT (2D) | RVOT1 (proximal RVOT) | Refer to BSE Right Heart guideline for details (1). | |
| RVOT2 (distal RVOT) | Refer to BSE Right Heart guideline for details (1). | ||
| PSAX PA (2D) | Qualitative assessment of PV leaflet morphology, leaflet thickening, systolic doming, loss of coaptation, prolapse, or presence of subvalvar or supravalvar (including branch) PS. | 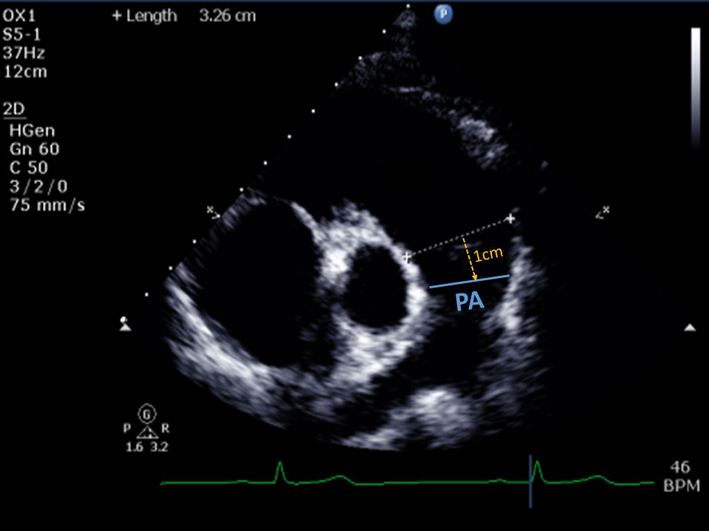 |
|
| Pulmonary artery (PA) diameter | PA dimension is measured in end-diastole, halfway between the PV and bifurcation of main PA (22), or 1 cm distal to the PA. A diameter > 25 mm is considered abnormal (64). A dilated PA may indicate pulmonary hypertension as a cause for PR. | ||
| PSAX RVOT (CFM) | Qualitative assessment of PR. Physiological PR jets are usually small, central and spindle-shaped (see image). Mild PR is likely if the jet has a narrow vena contracta and is <10 mm in length (21). Visual assessment of the level of any stenotic lesion by location of flow acceleration. |  |
|
| Severe PR is likely if the jet originates from or beyond the PA bifurcation. Caution: severe (‘free’) PR may be laminar, hence not easily seen on colour flow mode. | |||
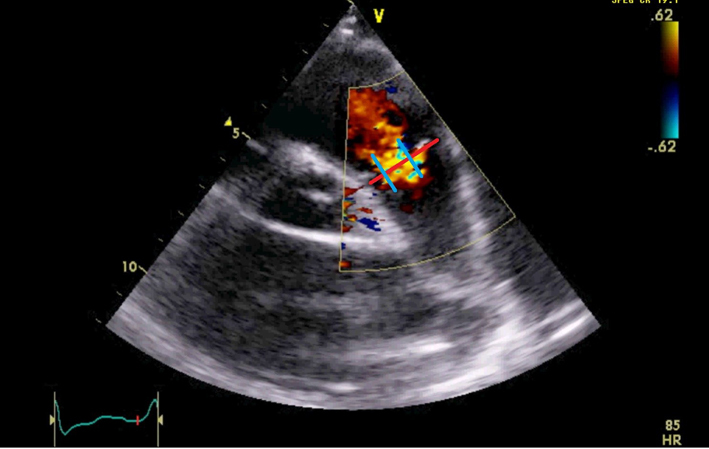
| PSAX RVOT (CFM) | PR jet width/RVOT width PR vena contracta (VC)/PV annular ratio 3D VC area (cm2) |
Maximal jet width is measured in diastole immediately below the PV. Jet width >65% of the RVOT width (RVOT2) is an indicator of severe PR (21). Caution: this measurement will vary according to the cut plane through the RVOT. VC/PV annulus ratio ≥ 50% is an indicator of greater than mild PR. A ratio ≥0.7 is a marker of severe PR (65, 66). See figure: red line indicates PV annulus diameter. The VC width is the distance between the 2 blue lines. 3D VC area > 1.15 cm2 is in keeping with severe PR (67). |
 |
| Visual assessment for diastolic flow reversal in a branch PA, which is a marker of severe PR. This has much greater specificity for CMR-derived severe PR than flow reversal in the main PA (68). The figure shows severe PR with large flow convergence, and flow reversal in the right pulmonary artery. | 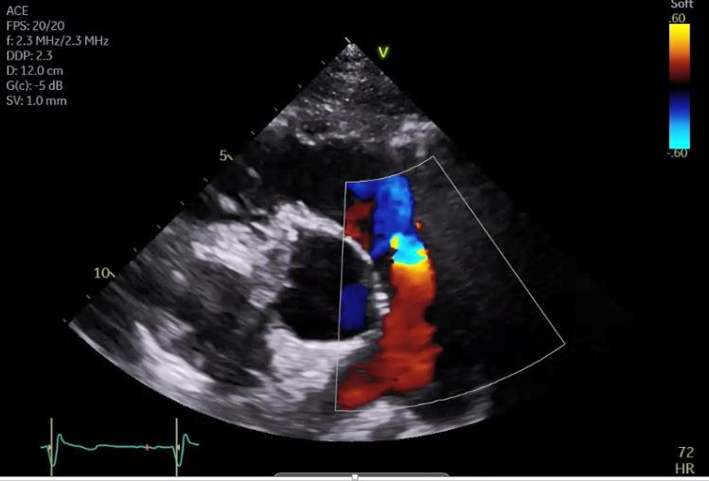 |
||
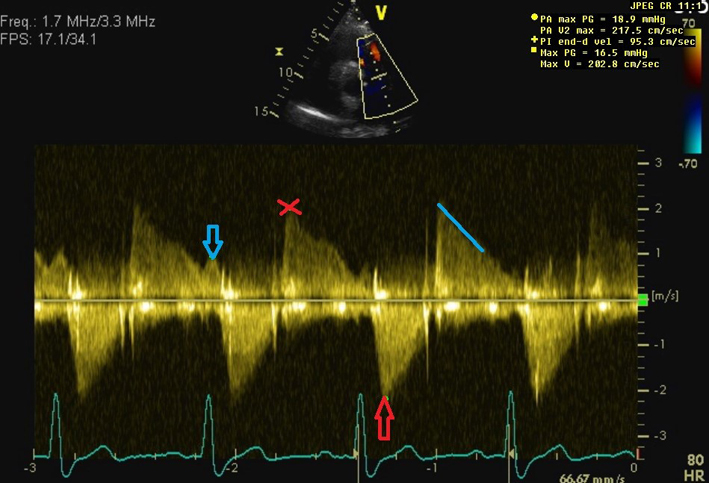
| PSAX RVOT (CW) | Qualitative inspection of the CW signal morphology. Right atrial contraction may be seen as late diastolic forward flow in the CW Doppler profile through the RVOT/PA (red arrows). This signal may be more prominent during inspiration and is a marker of restrictive RV physiology. Visual assessment of PR severity. Mild PR has a soft Doppler envelope with slow deceleration. Severe PR has a dense CW envelope with a triangular envelope (‘sine wave pattern’). |
 |
|
| PA Vmax
PR early velocity PR end-diastolic velocity |
<3 m/s is consistent with mild, 3–4 m/s moderate, and >4 m/s severe pulmonary stenosis (19). Visual assessment (2D) and PW Doppler are used to differentiate subvalvular, valvular and supravalvular PS. See red arrow on image. CW Doppler measurement through the pulmonary valve in line with the PR jet (red cross). An early PR velocity > 2.2 m/s is considered a marker of raised mean PA pressure (64). See Pulmonary Hypertension protocol for details (69). Can be used to estimate PA diastolic pressure, as 4 × (velocity)2 + RA pressure. RA pressure is estimated from IVC size and collapse (see below). See blue arrow on image. |
 |
|
| PR pressure half time PR deceleration time PR index |
The time taken for the PR pressure to halve is equivalent to initial velocity divided by 1.41. PR PHT< 100 ms is suggestive of severe PR (70). Note that this measure will be shorter in restrictive RV physiology. See white line on figure. The time taken for the early PR velocity to fall to zero. PR DT < 260 ms is in keeping with severe PR. The red line in the figure shows the deceleration slope. The blue line shows the deceleration time. The duration of the CW PR jet as a proportion of the whole of diastole. PR index < 0.77 is suggestive of severe PR (6). |
||
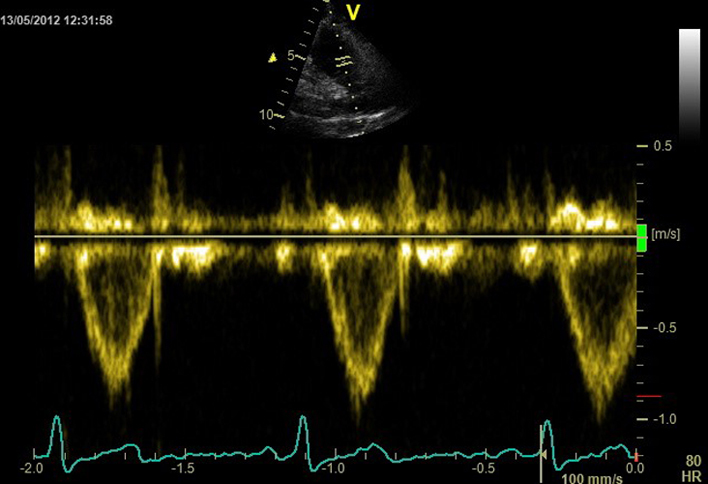
| PSAX RVOT (PW) | Can be used to determine the level of obstruction (subvalvular, valvular or supravalvar) if PA Vmax is elevated. | 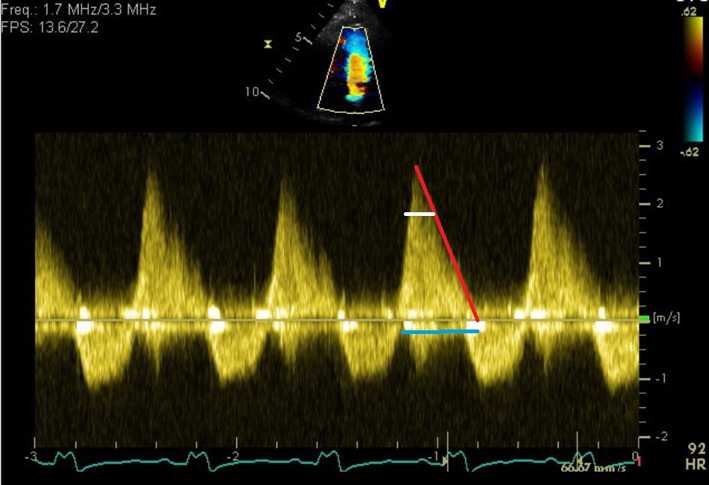 |
|
| Can also be used in the volumetric technique for calculating TR and PR regurgitant fractions (assuming only one significant regurgitant lesion exists): | |||
| RVOT area = π × (0.5 RVOT diameter)2 | |||
| RV stroke vol = RVOT area × RVOT VTI | |||
| Regurgitant volume = RV SV – LV SV | |||
| Regurgitant fraction = (regurgitant volume/RV stroke volume) ×100 | |||
| PSAX branch PA (PW) | Assessment for diastolic flow reversal in a branch PA, which is a marker of severe PR. See ‘PSAX RVOT (CFM)’ section previously. | ||
| RV-focused A4C (2D) | Right atrial area (RAA) | All measurements taken at end-diastole in the RV-focused view. Refer to BSE Right Heart guideline for details (1). | |
| RV linear dimensions RVD1, RVD2, RVD3 | |||
| RV fractional area change (FAC) | |||
| RV-focused A4C (2D) |
Tricuspid annular dimension |
Qualitative inspection of the TV leaflets. The septal leaflet is adjacent to the septum and the anterior or posterior leaflet is seen adjacent to the lateral RV free wall. Visual inspection for reduced leaflet coaptation. TVA dilatation is a sensitive marker of severe TR. Septal-lateral annular dimension measured at end-diastole. The normal TV annulus should measure 28 ± 5 mm. Annular dimension >40 mm (or >21 mm/m2) is considered significantly dilated (4). This measurement can be used in the volumetric technique for quantifying TR severity. Patients with secondary TR and annular dimensions greater than these values should be considered for TV intervention (e.g. annuloplasty) at the time of left-sided cardiac surgery, even if there is only mild or moderate secondary TR (5). |
 |
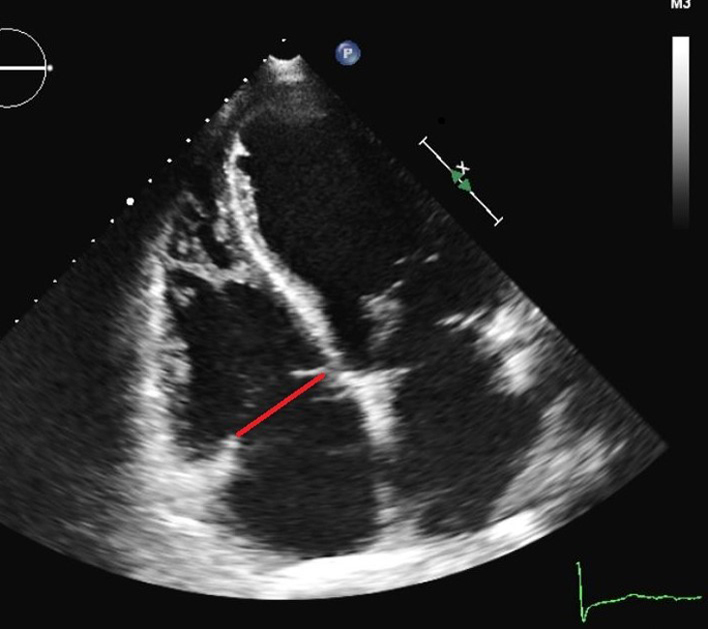
| RV focused A4C (2D) | TV tenting area TV tenting height |
Measured at end-systole as the area between the tricuspid annulus and the atrial aspect of the leaflets (red triangle). A tenting area >1 cm2 is predictive of more than mild secondary TR (18). A tenting area >1.6 cm2 is predictive of significant residual TR after TV surgery (62). Measured at end-systole between the plane of the TV annulus, and the leaflet coaptation point (blue line). A tenting height >0.76 cm is predictive of significant residual TR after TV surgery (62). |
 |
| A4C (M-mode) | Tricuspid annular plane systolic excursion (TAPSE) | Refer to BSE Right Heart guideline for details (1). | |
| A4C (CFM) | Visual assessment of TR severity. A very large central jet, or eccentric wall-impinging jet should alert to the possibility of severe TR. A large flow convergence at a Nyquist limit of 28 cm/s alerts to the presence of significant TR (71). A flow convergence visible throughout systole is more suggestive of severe TR than a brief flow convergence. |
 |
|
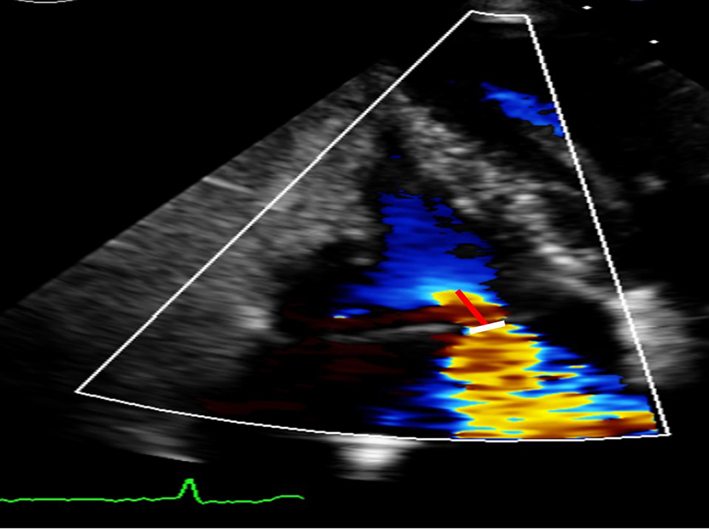
| TR VC width Proximal isovelocity surface area (PISA) radius |
The width of the TR jet at its narrowest point immediately after the regurgitant orifice (white line). VC ≥0.7 cm is consistent with severe, 0.3–0.69 cm moderate, and <0.3 cm mild TR. Caution: in multiple jets, VCs of the respective jets are not additive (21). The Nyquist limit is adjusted in the direction of the TR jet. The PISA radius is measured from the centre of the TV to the furthest point of the proximal flow convergence zone (red line). PISA radius (at Nyquist limit 28 cm/s) <0.5 cm is indicates mild, 0.5–0.9 moderate, and >0.9 cm severe TR (6). |
||
| A4C (CFM) | TR jet area | TR jet area > 10.0 cm2 suggests severe TR (6). A large, central jet occupying >50% of the RA is also suggestive of severe TR (6). | 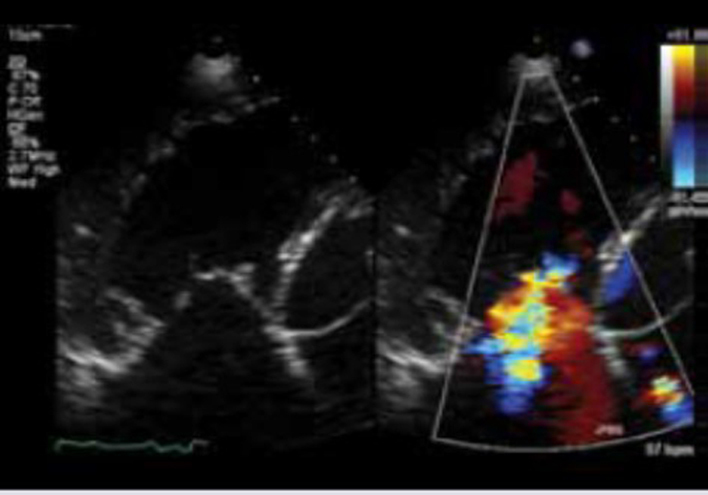 |
| Caution: central jets generally appear larger than eccentric jets of equal severity. A swirling, eccentric, wall impinging jet (Coanda effect) reaching the posterior RA wall suggests severe TR. | |||
| Caution: free-flowing severe TR may be low velocity and therefore non-aliaising. Jet area will underestimate TR severity in these circumstances. | |||
| A4C (PW) |
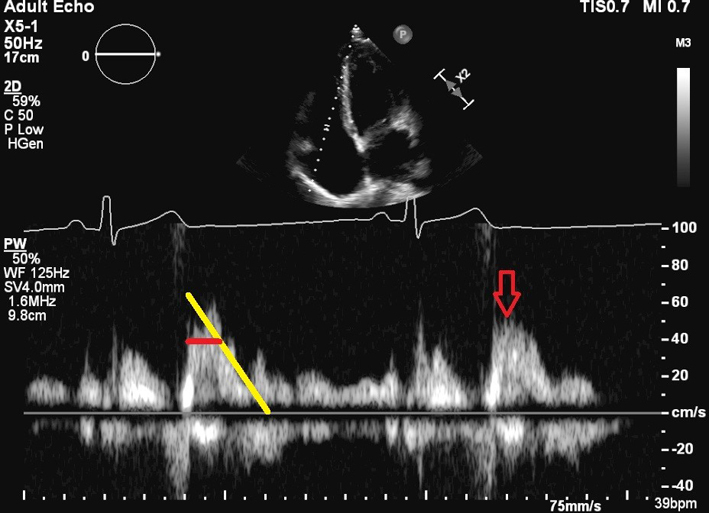
TV E wave velocity TV inflow pressure half time |
The view should be optimised in order to align the ultrasound beam with tricuspid inflow. This may require an unconventional/oblique angulation. TV inflow velocities vary with respiration, hence averaging should be performed over 5 beats. E velocity is indicated by the red arrow. In the presence of a suggestive colour Doppler jet, TV E ≥ 1 m/s is in keeping with severe TR (in the absence of tricuspid stenosis). The yellow line in the image shows the deceleration slope. The PHT (horizontal red line) is the time taken for the peak velocity (Vmax) to fall to Vmax/1.4. TV PHT ≥ 190 ms suggests severe TS (4). |
|
| TV area TV inflow mean pressure gradient |
TV area is calculated as 190/PHT. A value ≤1.0 cm2 indicates severe TS (4). Mean gradient ≥ 5 mmHg is considered to indicate severe TS (72). See image. The mean gradient is calculated from the area under the red line. |
 |
|
| A4C (CW) | Qualitative assessment of TR severity. Mild TR has a soft jet density and parabolic contour. Severe TR has a dense CW jet and early peaking or triangular CW envelope. See image – the TR jet density is similar to that of the forward tricuspid inflow signal density, and may appear like a ‘sine wave’ in very severe TR. Caution: central jets may appear denser than eccentric jets of similar severity. | 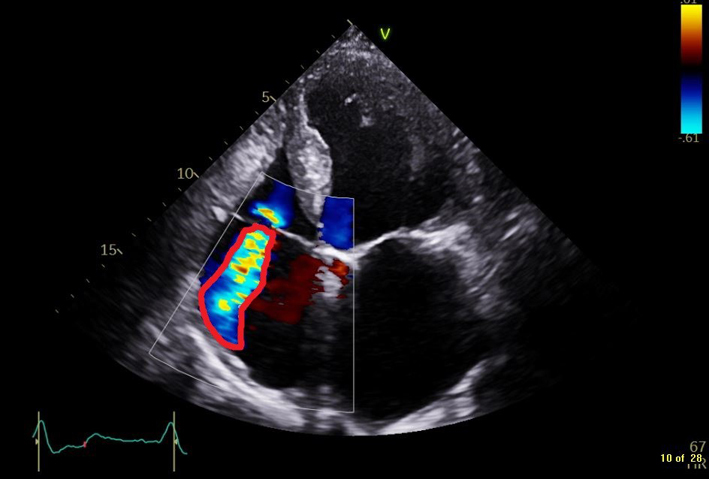 |
|
 |
|||
| Peak TR velocity TR effective regurgitant orifice area (EROA) |
TR Vmax is measured by CW Doppler across the tricuspid valve. Multiple views may need to be taken to obtain the optimal window. Note that the TR velocity itself is not indicative of TR severity. TR velocity can be underestimated in severe TR and this issue should be stated in the report if present. TR Vmax may be <2m/s in very severe TR (5). |
||
| See Pulmonary Hypertension protocol for details (69). | |||
| Calculated from the PISA radius, aliaising velocity, and peak TR velocity. EROA ≥ 0.4 cm2 is consistent with severe, 0.2–0.39 cm2 moderate, and <0.2 cm2 mild TR (6). Caution: the PISA technique is not valid for multiple jets and is less accurate in eccentric jets (6). Moreover, in TR it underestimates actual EROA due to the non-circularity of the regurgitant orifice and the flattened isovelocity surface. |
|||
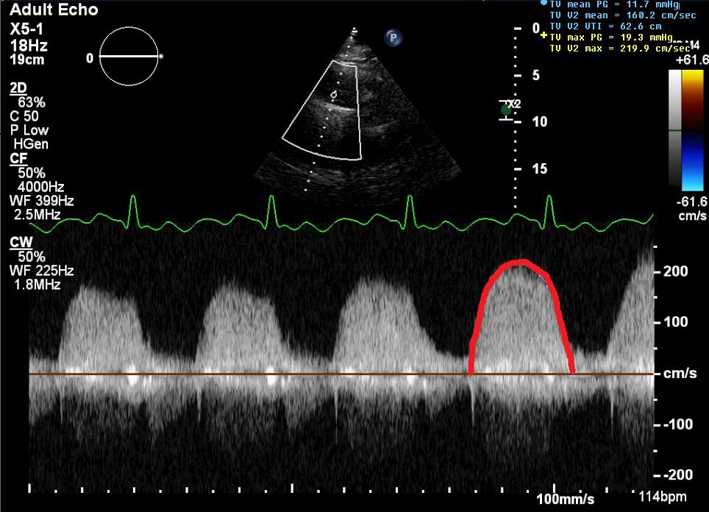 | |||
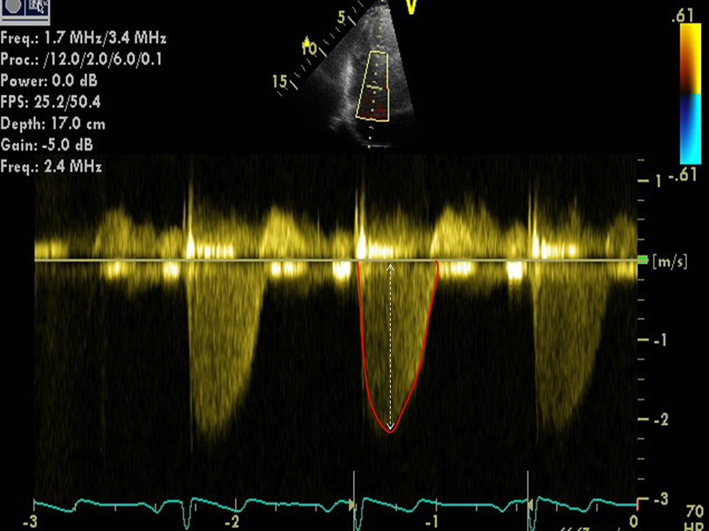
| TR regurgitant volume | Calculated from the EROA multiplied by the TR VTI (area inside the red outline in figure). Regurgitant volume ≥45 mL is consistent with severe, 30–44 mL moderate, and <30 mL mild TR (6). | ||
| Note that for a similar EROA, TV regurgitant volume is lower than for the MV, due to the lower driving pressure from the RV across the TV. TR regurgitant volume is subject to the same limitations as EROA (see previously). | 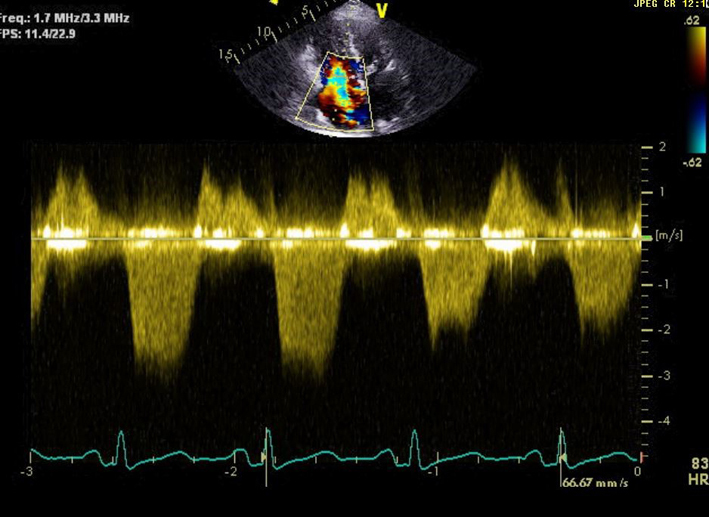 |
||
 |
|||
| A4C (tissue Doppler) | RV S’ | Refer to BSE Right Heart guideline for details (1). | |
| Subcostal (CFM) | Qualitative inspection of TR. | 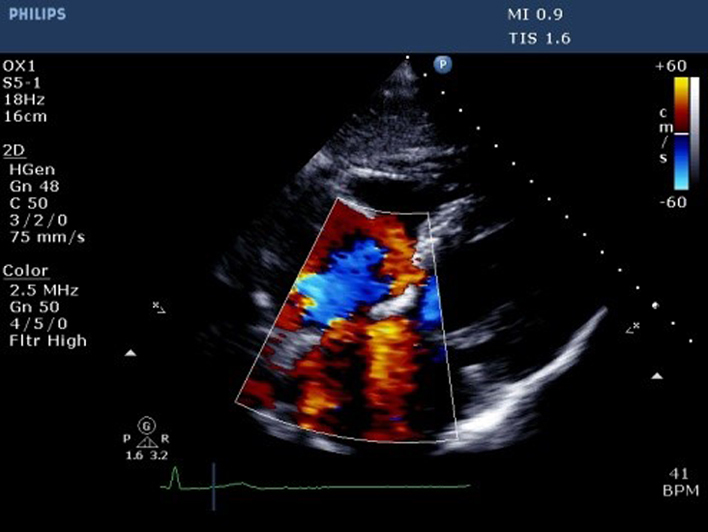 |
|
| Subcostal (CW) | Assessment of TR severity and TR Vmax | See A4C (CW). May be performed if good Doppler alignment with TR jet. | 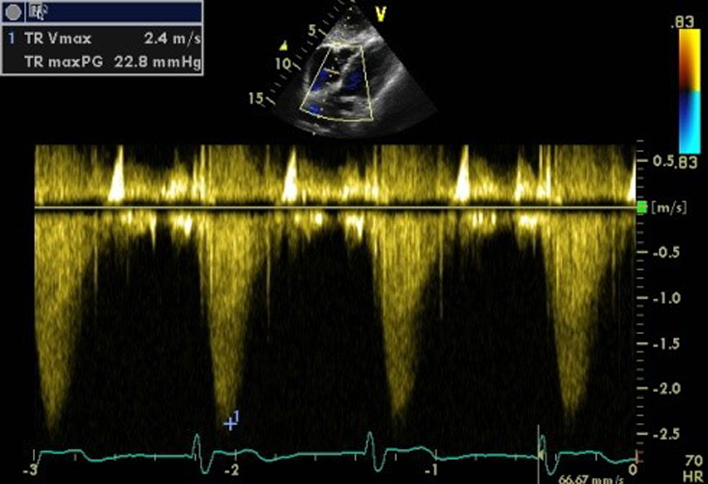 |
| Subcostal (2D) | IVC diameter | Diameter is measured perpendicular to the IVC long axis, 1–2 cm from the IVC/RA junction at end-expiration. | 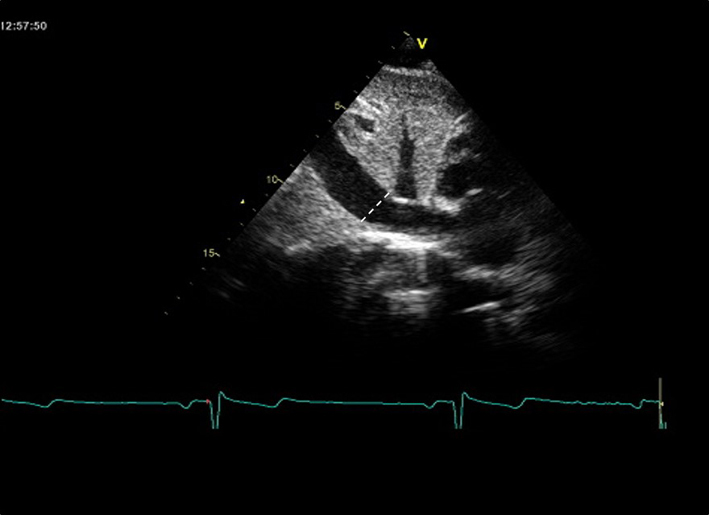 |
| Assess size and percentage reduction in diameter with sniffing or quiet inspiration (22, 64). | |||
| IVC diameter ≤ 21 mm, with >50% collapse with sniff suggests normal RA pressure and indicates that severe TR is unlikely to be present. A dilated IVC with decreased respiratory variation is in keeping with severe TR | |||
| Subcostal (PW) of hepatic veins |
HV S/D ratio |
Note that there is significant respiratory variation in these parameters, hence averaging over 5 beats should be performed. See BSE Right Heart guideline for explanation of different HV waveforms (1). S/D <1 may indicate increased RA pressure. |
 |
| HV systolic reversal waves | As TR severity increases, there is progressive blunting of the HV S wave velocity. Systolic blunting may be seen in greater than mild TR. Note: this is a non-specific finding which is also seen with impaired RV relaxation. Prominent systolic reversal waves (red arrows) are highly sensitive and more specific than systolic blunting for severe TR. | 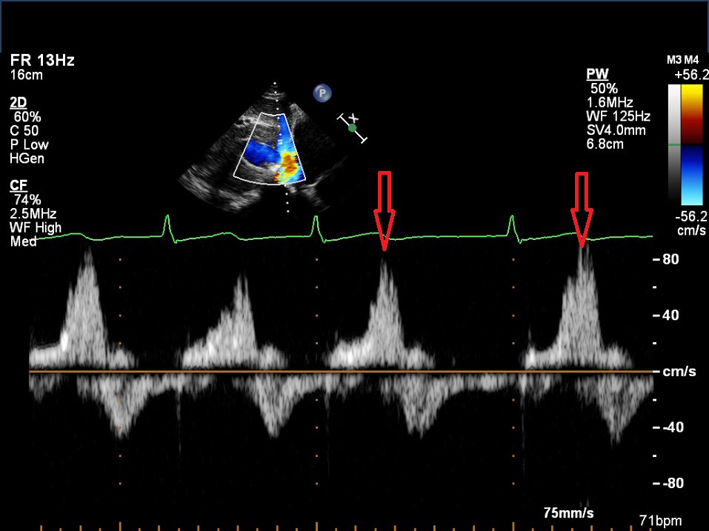 |
Table 2.
Transoesophageal echo assessment of the tricuspid and pulmonary valves.
| View (modality) | Explanatory notes | Image |
|---|---|---|
| Mid oesophageal 4-chamber at 0–15º (2D, CFM, CW, PW) | The septal and anterior/posterior leaflets of the TV are imaged in this view (see also Fig. 2 for explanation of imaging planes). Septal-lateral annular dimension can be measured at end-diastole. Note that CW assessment of TR jet velocity, and PW assessment of TV inflow should be attempted from multiple windows, according to the optimal alignment of the jet/s with the Doppler beam. |
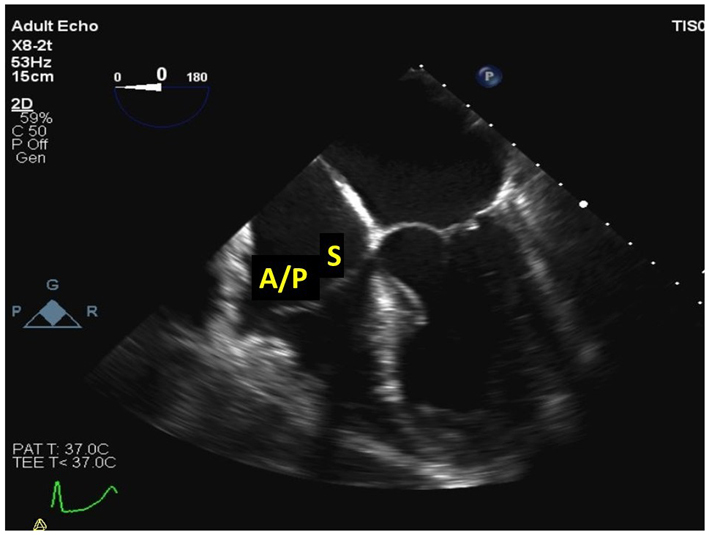 |
| Mid oesophageal 5-chamber view at 0–15º (2D, CFM, CW, PW) | Demonstrates the septal and anterior leaflets of the TV (see also Fig. 2 for explanation of imaging planes) | 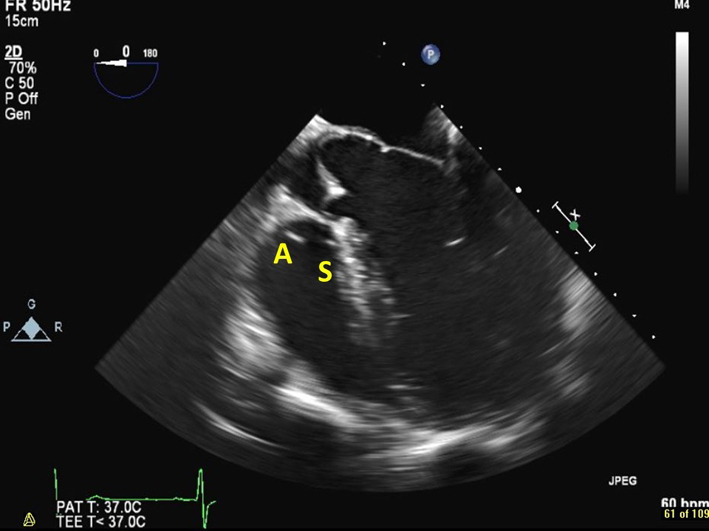 |
| Upper oesophageal at 0–15º (2D, CFM) | If the probe is withdrawn slightly from the mid oesophageal window, the main PA and PA bifurcation can be visualised. Doppler may demonstrate holodiastolic flow reversal in a branch PA in severe PR. | |
| Mid oesophageal, RV inflow-outflow view at 45–60º (2D, CFM, CW, PW) | Demonstrates the anterior or septal TV leaflets adjacent to the aortic valve, and the posterior leaflet laterally. The RVOT, PV and PA are also visualised in this view. | 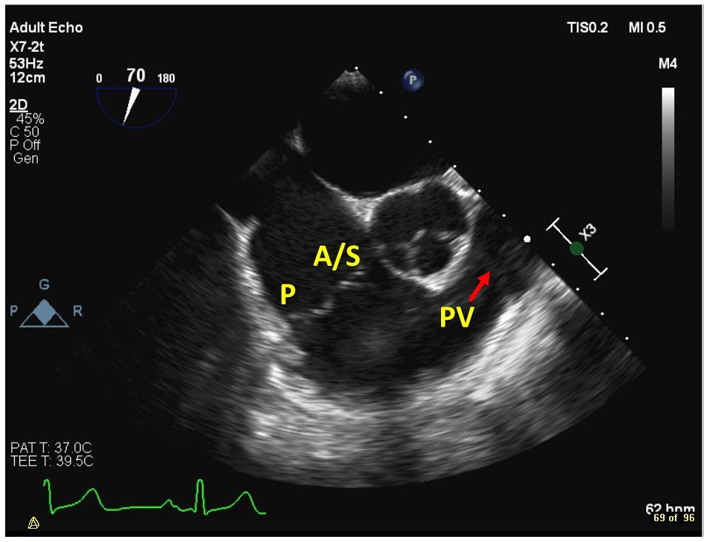 |
| Mid oesophageal, at 90º (2D, CFM) | The RVOT, PV and PA are well visualised in this view |  |
| Mid oesophageal modified bicaval view at 80–130º (2D, CFM, CW, PW) | Visualises the posterior and anterior leaflets of the TV. The TR jet is often well-aligned for CW Doppler assessment in this view. PW assessment of TV inflow is also often well-aligned from this view. The superior vena cava (SVC) is seen to the right of the image. The CS is denoted by the red star. | 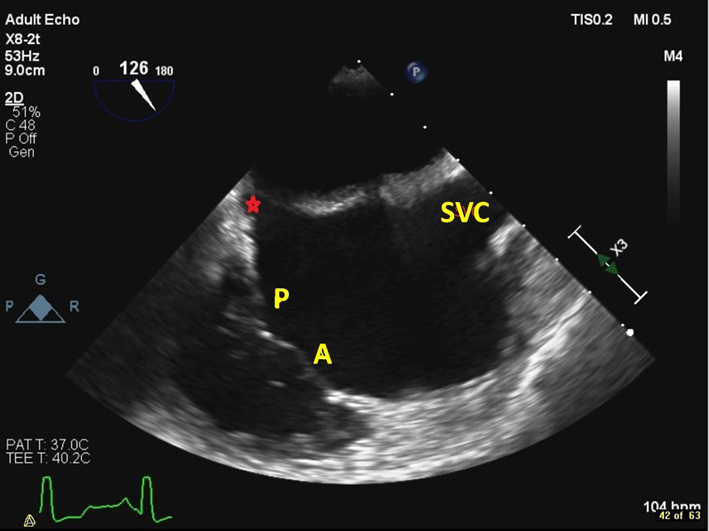 |
| Distal oesophageal, near the gastro-oesophageal junction at 0–15º (2D, 3D, CFM, CW, PW) | From this lower plane only the RA and coronary sinus lie directly in the beam of the probe. This view is therefore ideal for acquiring 3D volumes of the TV without interference from intervening left heart structures. The CS is denoted by the red star. | 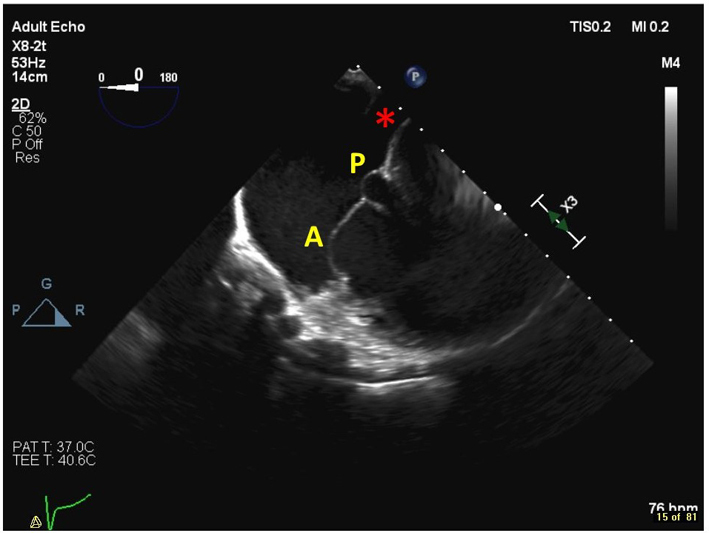 |
| Transgastric basal SAX view at 90º (2D, CFM) | This is the only 2D imaging plane in which all 3 tricuspid leaflets can be visualised simultaneously. The septal leaflet (S) is closest to the LV. The posterior leaflet (P) is in the near field, and the anterior leaflet (A) is in the far field. | 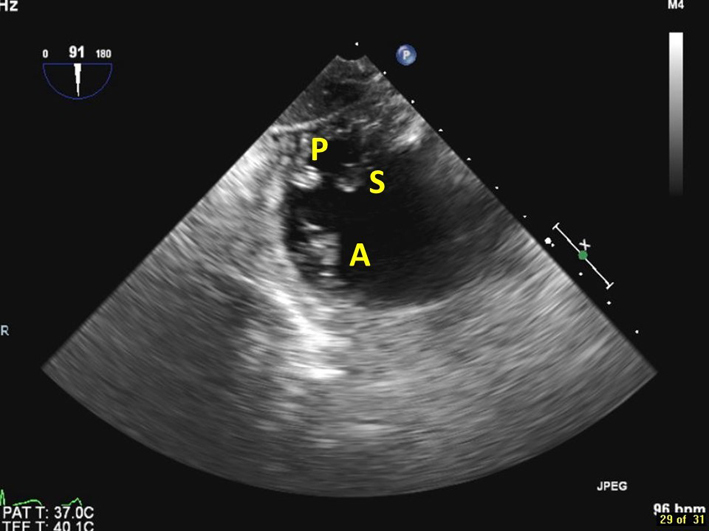 |
| Trangastric RV inflow view, at 80–120º (2D, CFM) | Images the anterior (ant) and inferior (inf) walls of the RV, as well as the papillary muscles, chordae, and TV. The posterior TV leaflet (P) is usually seen in the near field. | 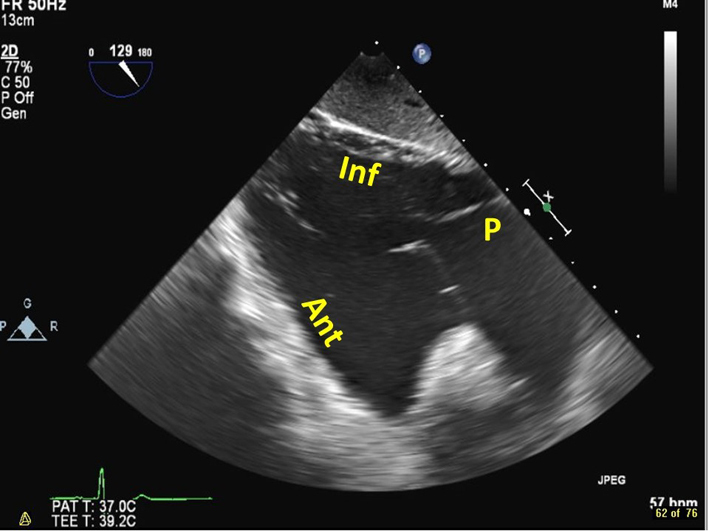 |
| Transgastric RV inflow-outflow view, at 100–120º (2D, CFM) | Images the RA, RV, RVOT and PA. The posterior TV leaflet (P) is usually seen in the near field, and the anterior leaflet (A) in the far field. | 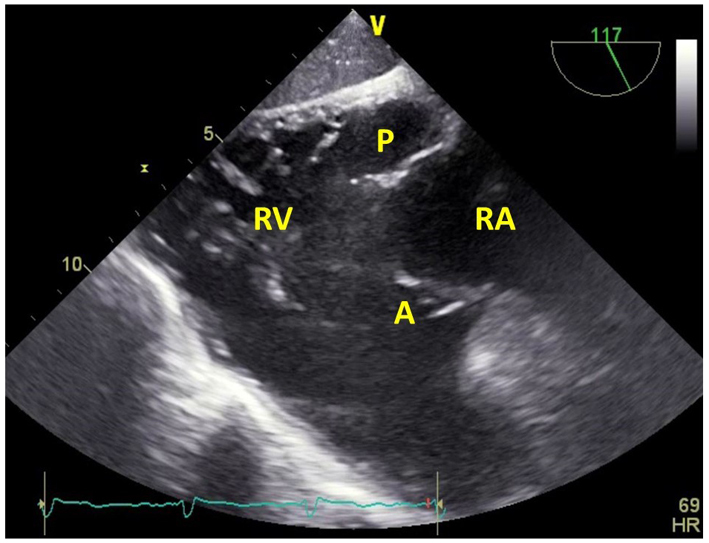 |
| Deep transgastric RV inflow-outflow view at 100–120º (2D, CFM, CW, PW) | The PV is also well visualised in the deep trangastric window at 120°. Doppler measurements through the PV may be well-aligned in this view. | 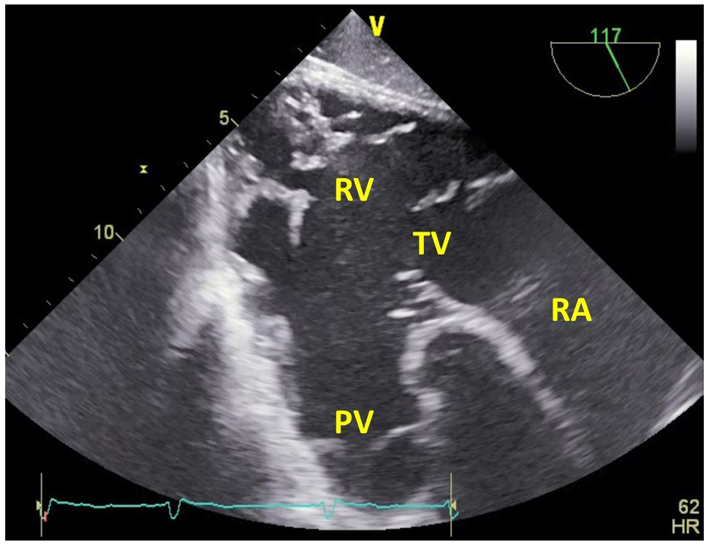 |
2D conventional imaging
The use of 2D imaging from multiple echocardiographic windows is required to determine the structural integrity, thickening, calcification and mobility of the valve leaflets. Optimisation of equipment settings, positioning of the transducer and patient, and respiratory manoeuvres should be undertaken to improve spatial resolution whilst maximising signal-to-noise ratio. This includes the use of zoom to focus on the valve, with complimentary adjustments of the dynamic range and gain settings. Careful visual assessment of the valve permits a qualitative assessment as to whether the appearances are consistent with significant disease. Valvular stenosis is generally associated with leaflet thickening with or without doming, restricted mobility and reduced separation at peak opening (19). When assessing a regurgitant valve it is important to demonstrate any valvular thickening, prolapse, reduced coaptation, or increased tenting area (6). 2D and 3D imaging additionally permit assessment of secondary RV, RA and inferior vena cava (IVC) remodelling.
Colour flow Doppler
The main determinants of the colour jet size are colour gain settings, momentum of the regurgitant jet, and its direction. A faster TR jet will entrain more blood in the receiving RA, such that a high velocity jet of mild TR may appear larger on CFM than it actually is. High RV systolic pressure will increase driving pressure and hence jet velocity, resulting in a larger jet. Similarly, severe TR may be of low velocity due to a large orifice area, reducing entrainment of flow in the RA, creating a misleadingly small colour jet (20). As a result, for the same colour jet area, the regurgitant volume of TR will be larger than that of mitral regurgitation (Fig. 4). The appearance of a jet of TR is also dependent on the minimum detectable velocity (usually 10% of the Nyquist limit) and this is even more apparent where jet propagation is constrained by chamber walls (e.g. eccentric TR) (6). The geometry and number of regurgitant orifices also significantly impacts on jet size, with multiple jets appearing collectively larger, without necessarily having the same haemodynamic consequences as a single large jet. It is important to note that the size of the distal jet in stenotic lesions does not help with grading severity, due to the complex interaction of these factors.
Figure 4.
The influence of driving pressure on apparent regurgitant jet area. The mitral regurgitation jet (top panels) and TR jet (bottom panels) both have a similar jet area. However, the RV driving pressure is much lower than LV pressure, hence the TR is probably more significant than the mitral regurgitation.
Instrumentation settings are equally important in determining jet size. A lower Nyquist limit and pulse repetition frequency will cause over-representation of lower velocity jets, such as those related to entrainment in the receiving chamber. It is recommended that the Nyquist limit should be set between 50 and 60 cm/s. High colour gain can cause noise to be misrepresented as blood flow. Conversely, low colour gain can eliminate important signals within the jet. It is therefore important to standardise practice by increasing the colour gain until saturation of the blood pool occurs, then gradually reducing until clutter is eliminated. In addition, any flow that is perpendicular to the beam will not be represented on the colour map. This is less apparent in turbulent flow such as in TS or PS, due to variance of flow direction.
The vena contracta (VC) is the narrowest part of the jet at or immediately distal to the orifice, and is less influenced by the factors that impact on overall jet size. For the TV and PV, the shape of the regurgitant VC is complex, and its linear measurement (particularly from a single view) should be interpreted with caution. A narrow region of interest should be used to permit greater temporal resolution when assessing the VC. The assessment of flow convergence prior to the lesion can be used qualitatively in both the TV and PV, for regurgitation and stenosis. However, the ability to obtain stenotic orifice area has not been validated thoroughly, and is also not recommended for the assessment of PR. Locating the flow convergence below the TV may utilise the standard Nyquist limit for qualitative assessment, but should be reduced to 28 cm/s for calculation of the proximal isovelocity surface area (PISA) radius (6, 21). Calculation of TR effective regurgitant orifice area (EROA) using PISA has not been as robustly validated as mitral regurgitation EROA, and should not be interpreted in isolation. Contour flattening is also more apparent in TR than in mitral regurgitation, due to lower jet velocity and a less circular TR orifice, leading to underestimation of the EROA. Conversely, PISA will often overestimate EROA with eccentric TR jets. The high temporal resolution of colour M-mode can be used to assess the timing and duration of TR during RV systole. Regurgitant jets limited to early and/or end-systole are unlikely to be severe.
Spectral Doppler
Continuous wave (CW) and pulsed wave (PW) Doppler can be used to provide qualitative and quantitative indices for stenosis and regurgitation. The Doppler signal should be optimised to maximise signal-to-noise ratio using gain and scale settings, whilst ensuring a sweep speed of 100 mm/s is used in stenosis. The ultrasound beam should be aligned with flow, hence the use of different imaging views is important. The CW signals provide quantitative information on jet velocity, pressure half time, mean gradients and timing of regurgitation, whilst PW is used to assess tricuspid forward flow, as well as flow in the hepatic veins (HV) in the setting of TR. Doppler profiles of right-sided flow are influenced by respiration (particularly TV inflow), which can be marked. This variability is more notable than with left-sided filling, hence averaging should be performed over three cardiac cycles (five cycles in atrial fibrillation) (22). Qualitative assessment of signal intensity is also important, with a dense signal suggesting more significant regurgitation.
Doppler velocities are related to preload and afterload, hence the presence of multiple valve lesions is likely to impact on values. TV inflow velocity and mean gradient will be elevated in the presence of significant TR, due to increased preload, rather than actual TS. Indices such as pressure half time may be challenging to calculate in tachycardic subjects, and should be assessed at heart rates <100 bpm where possible. The calculation of valve area by pressure half time according to the formula used for the mitral valve (220/T1/2) is less accurate when applied to the TV, with some data suggesting the use of an alternative constant (190/T1/2) (19). This has, however, not been well validated. The continuity equation is an alternative technique for the assessment of valve area in TS, in the absence of significant TR (23). TV area is calculated as ‘stroke volume/TV VTI’, with stroke volume measured from either the RV or LV outflow. This technique is time-consuming, cannot be applied in the presence of significant regurgitation from another valve, and requires further validation.
Impact on the RV and pulmonary circulation
It is important to understand the nature of cardiac adaptation in chronic TV and PV disease, since it can assist in the assessment of lesion severity, and guide the timing of interventions.
Impact of regurgitation on right-sided remodelling
Regurgitant flow causes an increased preload which is delivered to both the proximal and distal chambers, which must dilate to accommodate the increased blood. Therefore, chamber dilation is directly related to regurgitant severity. In significant TR, RA and RV dilatation will initially increase contractility through the Frank–Starling mechanism, making the ventricle appear hyperdynamic. The chronic impact of this however results in TVA dilatation, distortion of papillary muscle geometry, progressive valve tenting, and worsening regurgitation. As the RV dilates further, irreversible myocardial damage may occur, leading to progressive dysfunction. RV diastolic pressure will increase, causing the septum to displace towards the left in diastole, resulting in a D-shaped left ventricle (24). Therapeutic interventions should be performed prior to such advanced RV volume overload. It is imperative therefore that a full assessment of TVA, RA and RV dimensions, as well as functional indices, such as tricuspid annular plane systolic excursion (TAPSE), RV free wall longitudinal strain (25), and tissue Doppler S’ velocity, are closely monitored in patients with TR or PR undergoing echocardiographic surveillance. These measurements have been shown to support intervention by ensuring timely referral, resulting in improved post-surgical survival, and lower rates of post-operative residual TR (26, 27).
This process of pathological remodelling is similar in PR, with RV dilatation and dysfunction being the final manifestation of severe disease. Significant PR rarely occurs in isolation, and is usually associated with other congenital anomalies. In general the pulmonary circulation is able to tolerate even severe PR, due to its low resistance and close proximity to the heart, which allows blood to flow readily into the pulmonary microvasculature in systole (28). It follows therefore that PR may be worsened by any condition that elevates pulmonary artery pressure.
Impact of stenosis on right-sided remodelling
In PS, the RV must contract more forcefully to maintain stroke volume through the stenotic valve. The RV will remodel to overcome the elevated wall stress. The RV does not usually dilate in the early stages, but develops concentric hypertrophy (29, 30). Diastolic dysfunction and longitudinal systolic dysfunction are often the first manifestations of a cascade of RV deterioration, which can be detected using standard PW Doppler of trans-tricuspid filling, and tissue Doppler imaging of the RV lateral wall. RV dilatation and dysfunction are rare in PS, but may occur when the ventricle is unable to overcome progressive elevation of wall stress (22). Pressure overload on the RV can also impact on ventricular interdependence, with diastolic and systolic septal flattening which can in turn compromise LV filling (31). Careful assessment of RV size and function over time is important in determining the optimal timing of intervention. Conversely, the impact of tricuspid stenosis on the RV is negligible, with at most the appearance of a small cavity due to reduced preload. The elevated afterload however causes progressive RA dilatation. As a secondary downstream consequence, IVC engorgement and subsequent peripheral venous congestion may develop (32).
Transoesophageal echocardiography
TOE should be considered in TV or PV disease when TTE data are insufficient. However, due to the anterior position of the right heart in the chest, TTE imaging is often superior to TOE (for both 2DE and 3DE). In cases where TTE data are inconclusive, cardiac magnetic resonance (CMR) should also be considered as an alternative to TOE (see ‘Role of other imaging modalities’ section). TOE can be particularly helpful for the diagnosis of right heart endocarditis, since it permits excellent visualisation of prosthetic material such as venous catheters and pacemaker leads in the caval veins and RA, from the mid-oesophageal bicaval and transgastric windows. A detailed protocol for a comprehensive TOE examination has been published previously by the BSE (33). The views of relevance to the TV and PV are demonstrated in Table 2. In each view, the examination should be performed in 2D and colour flow modes, followed by Doppler interrogation if there is adequate alignment of flow with the ultrasound beam. 3DE should be considered for elucidation of the anatomy of any abnormalities found. RV and RA dimensions should however be quantified in the transthoracic RV-focused apical view. Intraoperative TOE is routinely used at the time of left-sided cardiac surgery to decide whether TV annuloplasty should be performed concomitantly. However, perioperative imaging must be evaluated together with pre-operative data, since right heart physiology is heavily influenced by loading conditions that change with conscious level, blood pressure, and mechanical ventilation; TR severity will generally be underestimated during general anaesthesia. TOE is used to guide catheter-based right-sided valve interventions, since it permits clearer visualisation of catheter positions and interactions with valve apparatus, can be performed continuously without hindering simultaneous x-ray fluoroscopy, and permits superior visualisation of left heart structures.
Three-dimensional echocardiography
3DE has greatly enriched our understanding of right-sided valvular heart disease, and has a number of practical applications. It is particularly helpful in suspected intracardiac device-related valvular disorders such as TR secondary to leaflet disruption, where volume-rendered display of the dataset may precisely delineate the location and nature of interactions between prosthetic material (e.g. pacing leads) and various components of the valve apparatus (Fig. 3). In recent years, the transition of right heart 3DE into regular clinical practice has been accelerated by the advent of transcatheter TV interventions, during which 3DE has proven indispensable for procedural guidance. Detailed description of this latter indication is beyond the scope of the present document.
3DE for right ventricular volume quantification
The complex structure of the RV renders it impossible to visualise all of its component parts simultaneously using 2DE. Quantifying the effects of right-sided heart valve lesions on RV remodelling has therefore been inconsistently performed using 2DE. Numerous studies have compared RV volumetric quantification by 3DE with the reference standard of CMR. Even using the latest algorithms, there is a tendency to underestimate RV volumes with 3DE (34). Conversely, RV ejection fraction by 3DE is comparable to CMR (35), and has demonstrated prognostic value in addition to TAPSE and fractional area change (36). Reference values for RV volumes and ejection fraction measured by 3DE, as well as threshold values for grading severity of RV dysfunction, have been published (37). Intravenous contrast may be used to improve RV endocardial delineation, with improved reproducibility and a reduction in bias for RV volume underestimation (38). 3DE RV dataset acquisition and post-processing has been comprehensively described in the recent BSE right heart guideline (1).
3DE of the pulmonary valve
Live TTE 3DE from the parasternal window can be effective in visualising en face PV short-axis morphology and quantifying cusp number (39). This information cannot, in general, be obtained using 2D TTE, since the PV can usually only be visualised in its long axis. However, by using 3DE biplane imaging formats allowing simultaneous 2D orthogonal views, a thorough interrogation of valve structure can be performed. Pulmonary annulus diameter derived by 3D TTE in patients with tetralogy of Fallot correlates more closely with surgical measurements, when compared to 2D TTE and cardiac CT (40).
3DE of the tricuspid valve
Perhaps the greatest strength of 3DE in right heart assessment has been in furthering our understanding of the anatomy of the TV, and the mechanisms, progression, and quantification of TR (15) (Figs 5, 6 and 7).
Figure 5.
The use of 3DE in the assessment of tricuspid regurgitation (TR). Panel A: The anterior (A), posterior (P) and septal (S) leaflets of the tricuspid valve (TV), the right ventricular outflow tract (RVOT), and mitral valve (MV) are displayed. Panel B: Volumetric analysis of the right ventricle (RV). Panel C: Characterisation of the complex structure of the TV annulus. Panel D: 3D colour flow analysis of TR severity.
Figure 6.
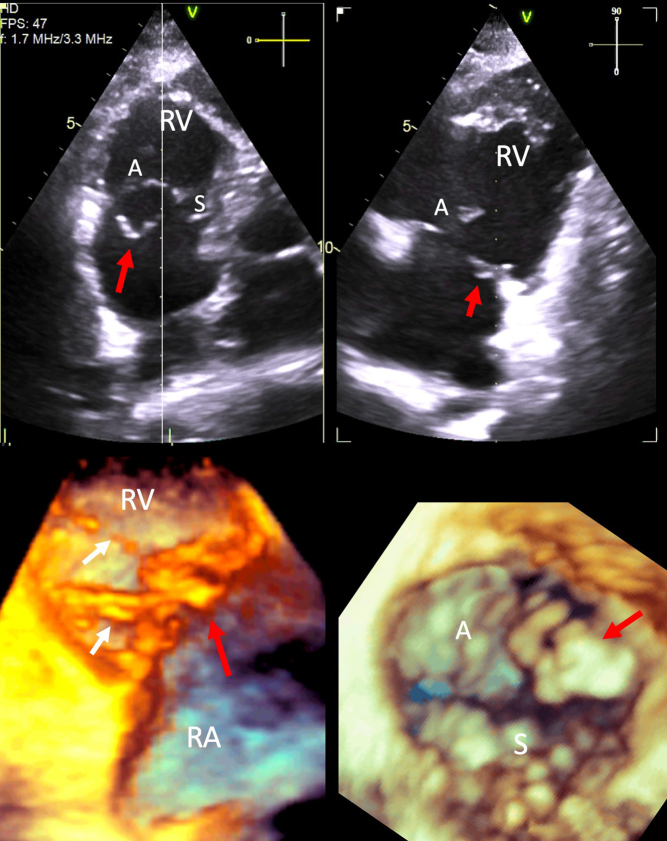
3DE of tricuspid valve (TV) leaflet prolapse. The top two images show transthoracic echo biplane imaging of the TV. The top left image (off axis A4C view) is live. The white line represents the position of the scan plane generating a simultaneous view seen in the top right image. The posterior leaflet of the TV is prolapsing and has a chordal rupture resulting in a partially flail segment (red arrow). The bottom left image shows the TV in profile with the flail posterior leaflet (red arrow). The white arrows depict the visible chordae tendinae. The bottom right image shows an en face view of the TV viewed from the right atrial surface. Posterior leaflet prolapse is seen (red arrow). A indicates the anterior TV leaflet; S, septal TV leaflet; RA, right atrium; RV, right ventricle.
Figure 7.
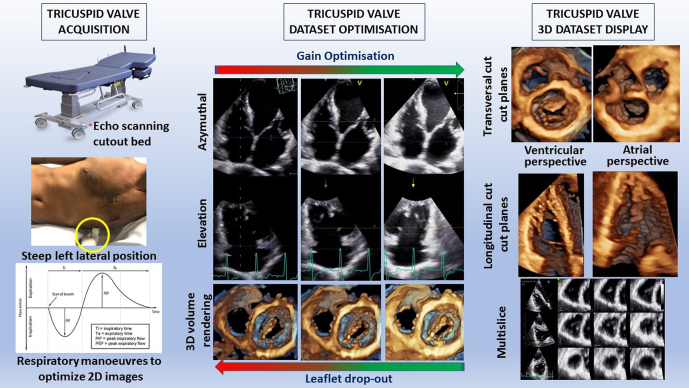
Acquisition and display of a three-dimensional transthoracic echocardiographic dataset of the tricuspid valve.
It is rarely possible to visualise all three leaflets of the TV simultaneously by 2D TTE or TOE. 3D TTE permits the acquisition of datasets of the TV in 85–90% of patients (Fig. 5A and Table 1 ‘Variable view, 3D imaging’). Post-processing of the TV dataset using cross-sectional and longitudinal cut planes allows visualisation throughout the cardiac cycle of all three leaflets en face, their commissures and attachments to the TVA, and the subvalvar apparatus (41). A standardised imaging display of the transversal cut planes is recommended, with the LV outflow tract at 12 o’clock regardless of whether the perspective is from the RA or RV (42). En face views of the TV can assist in understanding the precise localisation of defects such as prolapse, vegetations, and perforations, which may be particularly helpful for surgical colleagues. RV dimensions can be accurately quantified as discussed previously (Fig. 5B).
3DE has been particularly helpful in delineating the complex, saddle-shaped, non-planar structure of the TVA, and has provided novel insights into the process of annular dilatation leading to secondary TR (43). We are now able to appreciate how the D-shaped, ellipsoid TVA becomes more circular and planar as it dilates in the direction of the unsupported lateral and posterior RV free walls (8, 44). Quantification of TVA dimensions is superior using 3DE compared to 2DE, since the latter makes the geometric assumption that the annulus is circular. Using direct surgical measurements as the reference standard for TVA dimensions, intraoperative 3D TOE has been shown to be superior to intraoperative 2D TOE (45), whilst 2D TTE has been shown to systematically underestimate TVA dimensions when compared to 3D TOE (46). 3D TTE assessment of TVA dimensions is also more accurate than 2D TTE when CMR-derived annular dimensions are used as the reference standard (47) (Fig. 5C).
3DE is also helpful in the accurate quantification of TR severity. The addition of 3D colour Doppler acquisition permits improved localisation of regurgitant jets, as well as assessment of the regurgitant orifice by cropping down and measuring the VC width and VC area (the latter in essence representing the EROA) (Fig. 5D and Table 1 ‘Variable view, 3D CFM imaging). Indeed, 3D VC area correlates well with 2D EROA calculated using the flow convergence technique (48). The strength of 3D VC assessment lies in its non-reliance on geometric assumptions, unlike 2D VC measurements. Traditional 2DE approaches erroneously assumes a circular EROA. The TV regurgitant orifice morphology has been shown to be elliptical and rarely circular, given its trileaflet anatomy. Accurate depiction of the anatomic regurgitant orifice as described by the 3D VC avoids underestimation of TR severity. Consequently, the maximal VC diameter by 3DE is usually greater than the 2D measurement. 3DE VC area >0.4 cm2 is considered to indicate severe TR (48, 49). A novel sub-grading of severe TR itself into severe, massive and torrential categories using 3D TR VC area in addition to 2D EROA and biplane VC width has been postulated (50, 51). Finally, single heartbeat real-time TTE 3DE-derived PISA has been shown to be more accurate than 2D PISA, using 3D planimetered EROA as the reference (49).
The practical aspects of acquisition and display of a 3DE dataset of the TV using TTE are shown in Fig. 7. To improve the quality of the dataset, an echo scanning cut-out bed should be used to allow positioning of the patient in a steeper lateral position than that used for conventional 2DE, and to permit more lateral probe placement for the apical 2D views. The probe should be directed towards the right shoulder in order to obtain a true RV-focused view. Respiratory manoeuvres should be used to optimise 2D images. Optimal gain settings are critical to avoid dropout artefacts that are common when imaging the thin TV leaflets. Usually, the time gain compensation slides should be aligned slightly higher than 50% in order to create homogeneous gain, whilst the general gain should also be slightly higher than that used for 2DE. The initial focus should be on obtaining the best possible 2D images (best contrast and complete visualisation of the leaflets) independent of the probe position. It does not matter if the 2D view is foreshortened. Use of both the azimuthal and elevation planes, multi-slice and/or transversal cut planes using volume rendering display are used to ensure that the whole TV and TVA are included in the dataset throughout the cardiac cycle. Various display options are available. Transversal cut planes (both from the RV or the RA perspective) are used to assess the anatomy of the leaflets and the TVA, whilst longitudinal cut planes are used to assess the papillary muscles and the chordae. Multi-slices are used for linear measurements.
Stress echocardiography
Current consensus recommendations suggest that stress testing may be useful in assessing exercise capacity in severe TR when there are no or minimal symptoms (4). In most institutions, exercise is preferred over pharmacological stress for valve disease assessment, since it more closely recreates the conditions experienced by the patient during day-to-day exertion. The addition of echocardiography to exercise may permit assessment for occult or worsening valve dysfunction, detection of inducible myocardial ischaemia, and measurement of pulmonary pressure. Supine bicycle ergometry enables continuous scanning and is therefore preferable to treadmill stress, since indices such as pulmonary pressure may rapidly normalise upon cessation of exercise. RV functional reserve may be assessed by measuring TAPSE, RVS’, and RV fractional area change at rest and during stress (52). RV longitudinal strain may also be assessed during rest and stress, although this may become less reliable at heart rates > 100 bpm due to reduced frame rate (53). A failure to augment these indices suggests impaired RV functional reserve, which has been associated with worse outcomes in patients with left-sided valve disease (52). Data relating to right-sided valve disease and RV functional reserve are limited. One recent study utilised TAPSE at rest and stress to demonstrate impaired RV functional reserve in post-operative tetralogy of Fallot repair patients with RV dilatation, despite preserved resting TAPSE (54). Normal resting RV longitudinal function may therefore be falsely reassuring in the context of RV dilatation. Other studies have utilised a variety of exercise measurements, including TAPSE, RV fractional area change, and RV longitudinal strain, to demonstrate impaired RV functional reserve in tetralogy of Fallot repair patients with residual PR (55, 56). Further studies such as these are needed to help refine surgical criteria, by identifying patients that will benefit from earlier intervention due to occult RV dysfunction seen only during stress, or conversely those with irreversible RV damage in whom operative risk might outweigh any potential gains.
Role of other imaging modalities
Cardiac CT has a role in the planning of transcatheter TV and PV interventions, including assessment of annular dimensions, calcification, as well as RV and RA dimensions (57). CMR permits excellent visualisation of the right heart, which is not hindered by body morphological considerations such as obesity and artefact from surrounding tissues such as lungs and ribs. Any imaging plane can be selected in order to elaborate the region of interest. CMR is non-ionising and can be repeated serially without any harmful consequences, hence it is particularly appealing in the surveillance of young patients with congenital right heart lesions. CMR should be considered in TV or PV disease where the mechanism is not apparent on TTE, echo parameters are discordant, and in most cases where the aetiology relates to congenital heart disease. The addition of a gadolinium-based contrast agent has the unique ability to demonstrate myocardial fibrosis, including its extent, distribution, and pattern (ischaemic vs non-ischaemic). CMR is however relatively expensive and is less routinely accessible than echocardiography. Image quality can degraded by common arrhythmias such as atrial fibrillation, and in subjects who are unable to breath-hold adequately (58).
CMR is considered the gold standard for quantification of biventricular volumes and ejection fraction. In general, RV and RA volumes are larger on CMR compared with echo, since trabeculations are usually included in the blood pool during CMR post-processing, but excluded on echocardiography. It must be remembered, therefore, that data from these two techniques may be complimentary, but should not be considered interchangeable.
CMR is of particular utility in the assessment of congenital PV disease. It is excellent for evaluating the anatomy and dimensions of the main PA and its branches, as well as surgically constructed shunts. The severity of stenoses in the main PA, its branches, or within surgical conduits can be quantified by means of through-plane phase contrast imaging. The same technique can be used to quantify PR regurgitant volume and regurgitant fraction (RF). PR RF > 40% by CMR is considered to indicate severe regurgitation (59). Complimentary RV volume data can guide the appropriateness and timing of PV interventions. Post-operative RV reverse remodelling has been shown to be unlikely in patients who have previously undergone tetralogy of Fallot repair and have severe residual PR with significant RV dilatation (indexed end-diastolic volume >160 mL/m2, or indexed end-systolic volume >82 mL/m2) (60).
CMR may be used to assess TVA dimensions and TV morphology, although the thin TV leaflets in general limit the usefulness of this approach. TR severity can be indirectly calculated as the difference between the manually contoured RV and LV stroke volumes, in the absence of other significant regurgitant lesions or shunts. Alternatively, the pulmonary forward flow volume (by phase contrast imaging) subtracted from the contoured RV stroke volume should equate to the TR regurgitant volume (61). Whilst CMR thresholds have not been well validated, TR RF ≥ 50% is considered severe (58). Similar to that seen for PR, RV dilatation on CMR (indexed RV end-diastolic volume >164 mL/m2) has been associated with a low likelihood of RV functional recovery after re-intervention for severe residual TR in the context of previous left-sided valve surgery (17).
Key messages
Significant PV disease is most often congenital. The most common form of TV disease is functional TR due to TVA dilatation in the context of conditions such as AF, PH and left-sided heart disease. Significant TR is independently associated with adverse outcomes.
Comprehensive assessment of right-sided valve lesions requires a multi-faceted approach, utilising a variety of measurements and TTE modalities, which may be complimented by TOE, CT and CMR.
3D imaging has permitted significant advances in our understanding of the anatomy of the TV complex, as well as the aetiology and progression of secondary TR, and has helped to facilitate structural interventions for TV disease.
Exercise echocardiography is an emerging tool for the assessment of TV and PV disease, and has shown potential in unmasking subclinical disease and assessing functional reserve.
Conclusions
Transthoracic echocardiography remains the first-line imaging modality for the assessment of the aetiology, mechanism and severity of tricuspid and pulmonary valve disease, including the impact on right heart structure and function. Comprehensive assessment requires integration of data from multiple echocardiographic views and modalities, and may include 3D, transoesophageal, and exercise imaging. Imaging data must be interpreted within the context of patient symptoms in order to optimise the timing and technique of interventions. The rapid growth in percutaneous therapies for right-sided valve disease has made this area of cardiac imaging more relevant than ever before.
Supplementary Material
Declaration of interest
The authors declare that there is no conflict of interest that could be perceived as prejudicing the impartiality of this guideline.
Funding
This work did not receive any specific grant from any funding agency in the public, commercial, or not-for-profit sector.
References
- 1.Zaidi A, Knight DS, Augustine DX, Harkness A, Oxborough D, Pearce K, Ring L, Robinson S, Stout M, Willis Jet al. Echocardiographic assessment of the right heart in adults: a practical guideline from the British Society of Echocardiography. Echo Research and Practice 2020. 7 G19–G. ( 10.1530/ERP-19-0051) [DOI] [PMC free article] [PubMed] [Google Scholar]
- 2.Kwak JJ, Kim YJ, Kim MK, Kim HK, Park JS, Kim KH, Kim KB, Ahn H, Sohn DW, Oh BHet al. Development of tricuspid regurgitation late after left-sided valve surgery: a single-center experience with long-term echocardiographic examinations. American Heart Journal 2008. 155 732–7. ( 10.1016/j.ahj.2007.11.010) [DOI] [PubMed] [Google Scholar]
- 3.Shiran A, Najjar R, Adawi S, Aronson D.Risk factors for progression of functional tricuspid regurgitation. American Journal of Cardiology 2014. 113 995–1000. ( 10.1016/j.amjcard.2013.11.055) [DOI] [PubMed] [Google Scholar]
- 4.Nishimura RA, Otto CM, Bonow RO, Carabello BA, Erwin JP, Guyton RA, O’Gara PT, Ruiz CE, Skubas NJ, Sorajja Pet al. 2014 AHA/ACC guideline for the management of patients with valvular heart disease: executive summary: a report of the American College of Cardiology/American Heart Association Task Force on Practice Guidelines. Circulation 2014. 129 2440–24. ( 10.1161/CIR.0000000000000029) [DOI] [PubMed] [Google Scholar]
- 5.Baumgartner H, Falk V, Bax JJ, De Bonis M, Hamm C, Holm PJ, Iung B, Lancellotti P, Lansac E, Muñoz DRet al. 2017 ESC/EACTS Guidelines for the management of valvular heart disease. European Heart Journal 2017. 38 2739–2791. ( 10.1093/eurheartj/ehx391) [DOI] [PubMed] [Google Scholar]
- 6.Zoghbi WA, Adams D, Bonow RO, Enriquez-Sarano M, Foster E, Grayburn PA, Hahn RT, Han Y, Hung J, Lang RMet al. Recommendations for noninvasive evaluation of native valvular regurgitation: a report from the American Society of Echocardiography developed in collaboration with the Society for Cardiovascular Magnetic Resonance. Journal of the American Society of Echocardiography 2017. 30 303–3. ( 10.1016/j.echo.2017.01.007) [DOI] [PubMed] [Google Scholar]
- 7.Addetia K, Muraru D, Veronesi F, Jenei C, Cavalli G, Besser SA, Mor-Avi V, Lang RM, Badano LP.3-Dimensional echocardiographic analysis of the tricuspid annulus provides new insights into tricuspid valve geometry and dynamics. JACC: Cardiovascular Imaging 2019. 12 401–412. ( 10.1016/j.jcmg.2017.08.022) [DOI] [PubMed] [Google Scholar]
- 8.Fukuda S, Saracino G, Matsumura Y, Daimon M, Tran H, Greenberg NL, Hozumi T, Yoshikawa J, Thomas JD, Shiota T.Three-dimensional geometry of the tricuspid annulus in healthy subjects and in patients with functional tricuspid regurgitation: a real-time, 3-dimensional echocardiographic study. Circulation 2006. 114 (Supplement) I492–I498. ( 10.1161/CIRCULATIONAHA.105.000257) [DOI] [PubMed] [Google Scholar]
- 9.Hahn RT.State-of-the-art review of echocardiographic imaging in the evaluation and treatment of functional tricuspid regurgitation. Circulation: Cardiovascular Imaging 2016. 9 1–15. ( 10.1161/CIRCIMAGING.116.005332) [DOI] [PubMed] [Google Scholar]
- 10.Adler DS.Non-functional tricuspid valve disease. Annals of Cardiothoracic Surgery 2017. 6 204–2. ( 10.21037/acs.2017.04.04) [DOI] [PMC free article] [PubMed] [Google Scholar]
- 11.Rana BS, Robinson S, Francis R, Toshner M, Swaans MJ, Agarwal S, De Silva R, Rana AA, Nihoyannopoulos P.Tricuspid regurgitation and the right ventricle in risk stratification and timing of intervention. Echo Research and Practice 2019. 6 R25–R. ( 10.1530/ERP-18-0051) [DOI] [PMC free article] [PubMed] [Google Scholar]
- 12.Bhattacharyya S, Davar J, Dreyfus G, Caplin ME.Carcinoid heart disease. Circulation 2007. 116 2860–286. ( 10.1161/CIRCULATIONAHA.107.701367) [DOI] [PubMed] [Google Scholar]
- 13.Badano LP, Agricola E, Perez de Isla L, Gianfagna P, Zamorano JL.Evaluation of the tricuspid valve morphology and function by transthoracic real-time three-dimensional echocardiography. European Journal of Echocardiography 2009. 10 477–4. ( 10.1093/ejechocard/jep044) [DOI] [PubMed] [Google Scholar]
- 14.Muraru D, Guta AC, Ochoa-Jimenez RC, Bartos D, Aruta P, Mihaila S, Popescu BA, Iliceto S, Basso C, Badano LP.Functional regurgitation of atrioventricular valves and atrial fibrillation: an elusive pathophysiological link deserving further attention. Journal of the American Society of Echocardiography 2020. 33 42–53. ( 10.1016/j.echo.2019.08.016) [DOI] [PubMed] [Google Scholar]
- 15.Badano LP, Hahn R, Zanella H, Araiza Garaygordobil D, Ochoa-Jimenez RC, Muraru D.Morphological assessment of the tricuspid apparatus and grading regurgitation severity in patients with functional tricuspid regurgitation: thinking outside the box. Journal of the American College of Cardiology: Imaging 2019. 12 652–6. ( 10.1016/j.jcmg.2018.09.029) [DOI] [PubMed] [Google Scholar]
- 16.Silbiger JJ.Atrial functional tricuspid regurgitation: an underappreciated cause of secondary tricuspid regurgitation. Echocardiography 2019. 36 954–95. ( 10.1111/echo.14327) [DOI] [PubMed] [Google Scholar]
- 17.Kim HK, Kim YJ, Park EA, Bae JS, Lee W, Kim KH, Kim KB, Sohn DW, Ahn H, Park JHet al. Assessment of haemodynamic effects of surgical correction for severe functional tricuspid regurgitation: cardiac magnetic resonance imaging study. European Heart Journal 2010. 31 1520–152. ( 10.1093/eurheartj/ehq063) [DOI] [PubMed] [Google Scholar]
- 18.Kim HK, Kim YJ, Park JS, Kim KH, Kim KB, Ahn H, Sohn DW, Oh BH, Park YB, Choi YS.Determinants of the severity of functional tricuspid regurgitation. American Journal of Cardiology 2006. 98 236–2. ( 10.1016/j.amjcard.2006.01.082) [DOI] [PubMed] [Google Scholar]
- 19.Baumgartner H, Hung J, Bermejo J, Chambers JB, Evangelista A, Griffin BP, Iung B, Otto CM, Pellikka PA, Quiñones Met al. Echocardiographic assessment of valve stenosis: EAE/ASE recommendations for clinical practice. European Journal of Echocardiography 2009. 10 1–25. ( 10.1093/ejechocard/jen303) [DOI] [PubMed] [Google Scholar]
- 20.Thomas JD, Liu CM, Flachskampf FA, O’Shea JP, Davidoff R, Weyman AE.Quantification of jet flow by momentum analysis: an in vitro color Doppler flow study. Circulation 1990. 81 247–2. ( 10.1161/01.cir.81.1.247) [DOI] [PubMed] [Google Scholar]
- 21.Lancellotti P, Tribouilloy C, Hagendorff A, Popescu BA, Edvardsen T, Pierard LA, Badano L, Zamorano JL.Scientific Document Committee of the European Association of Cardiovascular Imaging. Recommendations for the echocardiographic assessment of native valvular regurgitation: an executive summary from the European Association of Cardiovascular Imaging. European Heart Journal Cardiovascular Imaging 2013. 14 611–6. ( 10.1093/ehjci/jet105) [DOI] [PubMed] [Google Scholar]
- 22.Rudski LG, Lai WW, Afilalo J, Hua L, Handschumacher MD, Chandrasekaran K, Solomon SD, Louie EK, Schiller NB.Guidelines for the echocardiographic assessment of the right heart in adults: a report from the American Society of Echocardiography. Endorsed by the European Association of Echocardiography, a registered branch of the European Society of Cardiology, and the Canadian Society of Echocardiography. Journal of the American Society of Echocardiography 2010. 23 685–713; quiz 786. ( 10.1016/j.echo.2010.05.010) [DOI] [PubMed] [Google Scholar]
- 23.Karp K, Teie D, Eriksson P.Doppler echocardiographic assessment of the valve area in patients with atrioventricular valve stenosis by application of the continuity equation. Journal of Internal Medicine 1989. 225 261–26. ( 10.1111/j.1365-2796.1989.tb00076.x) [DOI] [PubMed] [Google Scholar]
- 24.Antunes MJ, Barlow JB.Management of tricuspid valve regurgitation. Heart 2007. 93 271–27. ( 10.1136/hrt.2006.095281) [DOI] [PMC free article] [PubMed] [Google Scholar]
- 25.Prihadi EA, Van Der Bijl P, Dietz M, Abou R, Vollema EM, Marsan NA, Delgado V, Bax JJ.Prognostic implications of right ventricular free wall longitudinal strain in patients with significant functional tricuspid regurgitation. Circulation. Cardiovascular Imaging 2019. 12 e008666. ( 10.1161/CIRCIMAGING.118.008666) [DOI] [PubMed] [Google Scholar]
- 26.Nath J, Foster E, Heidenreich PA.Impact of tricuspid regurgitation on long-term survival. Journal of the American College of Cardiology 2004. 43 405–40. ( 10.1016/j.jacc.2003.09.036) [DOI] [PubMed] [Google Scholar]
- 27.Kammerlander AA, Marzluf BA, Graf A, Bachmann A, Kocher A, Bonderman D, Mascherbauer J.Right ventricular dysfunction, but not tricuspid regurgitation, is associated with outcome late after left heart valve procedure. Journal of the American College of Cardiology 2014. 64 2633–26. ( 10.1016/j.jacc.2014.09.062) [DOI] [PubMed] [Google Scholar]
- 28.Bouzas B, Kilner PJ, Gatzoulis MA.Pulmonary regurgitation: not a benign lesion. European Heart Journal 2005. 26 433–43. ( 10.1093/eurheartj/ehi091) [DOI] [PubMed] [Google Scholar]
- 29.Driessen MMP, Leiner T, Sieswerda GT, Van Dijk APJ, Post MC, Friedberg MK, Mertens L, Doevendans PA, Snijder RJ, Hulzebos EHet al. RV adaptation to increased afterload in congenital heart disease and pulmonary hypertension. PLoS ONE 2018. 13 1–17. ( 10.1371/journal.pone.0205196) [DOI] [PMC free article] [PubMed] [Google Scholar]
- 30.Ruckdeschel E, Kim YY.Pulmonary valve stenosis in the adult patient: pathophysiology, diagnosis and management. Heart 2019. 105 414–4. ( 10.1136/heartjnl-2017-312743) [DOI] [PubMed] [Google Scholar]
- 31.Ryan T, Petrovic O, Dillon JC, Feigenbaum H, Conley MJ, Armstrong WF.An echocardiographic index for separation of right ventricular volume and pressure overload. Journal of the American College of Cardiology 1985. 5 918–927. ( 10.1016/s0735-1097(8580433-2) [DOI] [PubMed] [Google Scholar]
- 32.Vaideeswar P & Butany J. Valvular Heart Disease. In Cardiovascular Pathology (fourth edition), ch 12, pp 485–528. Eds Buja LM & Butany J. Cambridge, MA, USA: Academic Press. ( 10.1016/B978-0-12-420219-1.00012-4) [DOI] [Google Scholar]
- 33.Wheeler R, Steeds R, Rana B, Wharton G, Smith N, Allen J, Chambers J, Jones R, Lloyd G, O’Gallagher Ket al. A minimum dataset for a standard transoesophageal echocardiogram: a guideline protocol from the British Society of Echocardiography. Echo Research and Practice 2015. 2 G29–G. ( 10.1530/ERP-15-0024) [DOI] [PMC free article] [PubMed] [Google Scholar]
- 34.Muraru D, Spadotto V, Cecchetto A, Romeo G, Aruta P, Ermacora D, Jenei C, Cucchini U, Iliceto S, Badano LP.New speckle-tracking algorithm for right ventricular volume analysis from three-dimensional echocardiographic data sets: validation with cardiac magnetic resonance and comparison with the previous analysis tool. European Heart Journal Cardiovascular Imaging 2016. 17 1279–12. ( 10.1093/ehjci/jev309) [DOI] [PubMed] [Google Scholar]
- 35.Shimada YJ, Shiota M, Siegel RJ, Shiota T.Accuracy of right ventricular volumes and function determined by three-dimensional echocardiography in comparison with magnetic resonance imaging: a meta-analysis study. Journal of the American Society of Echocardiography 2010. 23 943–9. ( 10.1016/j.echo.2010.06.029) [DOI] [PubMed] [Google Scholar]
- 36.Nagata Y, Wu VCC, Kado Y, Otani K, Lin FC, Otsuji Y, Negishi K, Takeuchi M.Prognostic value of right ventricular ejection fraction assessed by transthoracic 3D echocardiography. Circulation: Cardiovascular Imaging 2017. 10 1–10. ( 10.1161/CIRCIMAGING.116.005384) [DOI] [PubMed] [Google Scholar]
- 37.Maffessanti F, Muraru D, Esposito R, Gripari P, Ermacora D, Santoro C, Tamborini G, Galderisi M, Pepi M, Badano LP.Age-, body size-, and sex-specific reference values for right ventricular volumes and ejection fraction by three-dimensional echocardiography: a multicenter echocardiographic study in 507 healthy volunteers. Circulation: Cardiovascular Imaging 2013. 6 700–7. ( 10.1161/CIRCIMAGING.113.000706) [DOI] [PubMed] [Google Scholar]
- 38.Medvedofsky D, Mor-Avi V, Kruse E, Guile B, Ciszek B, Weinert L, Yamat M, Volpato V, Addetia K, Patel ARet al. Quantification of right ventricular size and function from contrast-enhanced three-dimensional echocardiographic images. Journal of the American Society of Echocardiography 2017. 30 1193–1. ( 10.1016/j.echo.2017.08.003) [DOI] [PubMed] [Google Scholar]
- 39.Kelly NFA, Platts DG, Burstow DJ.Feasibility of pulmonary valve imaging using three-dimensional transthoracic echocardiography. Journal of the American Society of Echocardiography 2010. 23 1076–10. ( 10.1016/j.echo.2010.06.015) [DOI] [PubMed] [Google Scholar]
- 40.Hadeed K, Hascoët S, Amadieu R, Dulac Y, Breinig S, Cazavet A, Cuttone F, Leóbon B, Acar P.3D transthoracic echocardiography to assess pulmonary valve morphology and annulus size in patients with tetralogy of Fallot. Archives of Cardiovascular Diseases 2016. 109 87–95. ( 10.1016/j.acvd.2015.12.001) [DOI] [PubMed] [Google Scholar]
- 41.Muraru D, Hahn RT, Soliman OI, Faletra FF, Basso C, Badano LP.3-Dimensional echocardiography in imaging the tricuspid valve. JACC: Cardiovascular Imaging 2019. 12 500–5. ( 10.1016/j.jcmg.2018.10.035) [DOI] [PubMed] [Google Scholar]
- 42.Lang RM, Badano LP, Tsang W, Adams DH, Agricola E, Buck T, Faletra FF, Franke A, Hung J, Peŕez De Isla Let al. EAE/ASE recommendations for image acquisition and display using three-dimensional echocardiography. European Heart Journal: Cardiovascular Imaging 2012. 13 1–46. ( 10.1093/ehjci/jer316) [DOI] [PubMed] [Google Scholar]
- 43.Badano LP, Caravita S, Rella V, Guida V, Parati G, Muraru D.The added value of 3-dimensional echocardiography to understand the pathophysiology of functional tricuspid regurgitation. JACC: Cardiovascular Imaging 2020. [epub]. ( 10.1016/j.jcmg.2020.04.029) [DOI] [PubMed] [Google Scholar]
- 44.Ton-Nu TT, Levine RA, Handschumacher MD, Dorer DJ, Yosefy C, Fan D, Hua L, Jiang L, Hung J.Geometric determinants of functional tricuspid regurgitation: insights from 3-dimensional echocardiography. Circulation 2006. 114 143–14. ( 10.1161/CIRCULATIONAHA.106.611889) [DOI] [PubMed] [Google Scholar]
- 45.Bhatt HV, Spivack J, Patel PR, El-Eshmawi A, Amir Y, Adams DH, Fischer GW.Correlation of 2-dimensional and 3-dimensional echocardiographic analysis to surgical measurements of the tricuspid valve annular diameter. Journal of Cardiothoracic and Vascular Anesthesia 2019. 33 137–1. ( 10.1053/j.jvca.2018.05.048) [DOI] [PubMed] [Google Scholar]
- 46.Dreyfus J, Durand-Viel G, Raffoul R, Alkhoder S, Hvass U, Radu C, Al-Attar N, Ghodbhane W, Attias D, Nataf Pet al. Comparison of 2-dimensional, 3-dimensional, and surgical measurements of the tricuspid annulus size: clinical implications. Circulation: Cardiovascular Imaging 2015. 8 e003241. ( 10.1161/CIRCIMAGING.114.003241) [DOI] [PubMed] [Google Scholar]
- 47.Anwar AM, Soliman OII, Nemes A, van Geuns RJM, Geleijnse ML, ten Cate FJ.Value of assessment of tricuspid annulus: real-time three-dimensional echocardiography and magnetic resonance imaging. International Journal of Cardiovascular Imaging 2007. 23 701–705. ( 10.1007/s10554-006-9206-4) [DOI] [PMC free article] [PubMed] [Google Scholar]
- 48.Chen TE, Kwon SH, Enriquez-Sarano M, Wong BF, Mankad SV.Three-dimensional color Doppler echocardiographic quantification of tricuspid regurgitation orifice area: comparison with conventional two-dimensional measures. Journal of the American Society of Echocardiography 2013. 26 1143–11. ( 10.1016/j.echo.2013.07.020) [DOI] [PubMed] [Google Scholar]
- 49.De Agustin JA, Viliani D, Vieira C, Islas F, Marcos-Alberca P, Gomez De Diego JJ, Nuñez-Gil IJ, Almeria C, Rodrigo JL, Luaces Met al. Proximal isovelocity surface area by single-beat three-dimensional color Doppler echocardiography applied for tricuspid regurgitation quantification. Journal of the American Society of Echocardiography 2013. 26 1063–10. ( 10.1016/j.echo.2013.06.006) [DOI] [PubMed] [Google Scholar]
- 50.Hahn RT, Zamorano JL.The need for a new tricuspid regurgitation grading scheme. European Heart Journal Cardiovascular Imaging 2017. 18 1342–134. ( 10.1093/ehjci/jex139) [DOI] [PubMed] [Google Scholar]
- 51.Velayudhan DE, Brown TM, Nanda NC, Patel V, Miller AP, Mehmood F, Rajdev S, Fang L, Frans EE, Vengala Set al. Quantification of tricuspid regurgitation by live three-dimensional transthoracic echocardiographic measurements of vena contracta area. Echocardiography 2006. 23 793–800. ( 10.1111/j.1540-8175.2006.00314.x) [DOI] [PubMed] [Google Scholar]
- 52.Vitel E, Galli E, Leclercq C, Fournet M, Bosseau C, Corbineau H, Bouzille G, Donal E.Right ventricular exercise contractile reserve and outcomes after early surgery for primary mitral regurgitation. Heart 2018. 104 855–8. ( 10.1136/heartjnl-2017-312097) [DOI] [PubMed] [Google Scholar]
- 53.Johnson C, Kuyt K, Oxborough D, Stout M.Practical tips and tricks in measuring strain, strain rate and twist for the left and right ventricles. Echo Research and Practice 2019. 6 R87–R. ( 10.1530/ERP-19-0020) [DOI] [PMC free article] [PubMed] [Google Scholar]
- 54.Kingsley C, Ahmad S, Pappachan J, Khambekar S, Smith T, Gardiner D, Shambrook J, Baskar S, Moore R, Veldtman G.Right ventricular contractile reserve in tetralogy of Fallot patients with pulmonary regurgitation. Congenital Heart Disease 2018. 13 288–2. ( 10.1111/chd.12569) [DOI] [PubMed] [Google Scholar]
- 55.Bhatt SM, Wang Y, Elci OU, Goldmuntz E, McBride M, Paridon S, Mercer-Rosa L.Right ventricular contractile reserve is impaired in children and adolescents with repaired tetralogy of Fallot: an exercise strain imaging study. Journal of the American Society of Echocardiography 2019. 32 135–1. ( 10.1016/j.echo.2018.08.008) [DOI] [PMC free article] [PubMed] [Google Scholar]
- 56.Ait-Ali L, Siciliano V, Passino C, Molinaro S, Pasanisi E, Sicari R, Pingitore A, Festa P.Role of stress echocardiography in operated Fallot: feasibility and detection of right ventricular response. Journal of the American Society of Echocardiography 2014. 27 1319–13. ( 10.1016/j.echo.2014.08.006) [DOI] [PubMed] [Google Scholar]
- 57.Prihadi EA, Delgado V, Hahn RT, Leipsic J, Min JK, Bax JJ.Imaging needs in novel transcatheter tricuspid valve interventions. JACC: Cardiovascular Imaging 2018. 11 736–7. ( 10.1016/j.jcmg.2017.10.029) [DOI] [PubMed] [Google Scholar]
- 58.Myerson S, Francis J, Neubauer S.(Eds). Cardiovascular Magnetic Resonance (Oxford Specialist Handbooks in Cardiology). Oxford University Press, 2010. [Google Scholar]
- 59.Mercer-Rosa L, Yang W, Kutty S, Ruchik J, Fogel M, Goldmuntz E.Quantifying pulmonary regurgitation and right ventricular function in surgically repaired tetralogy of Fallot: a comparative analysis of echocardiography and magnetic resonance imaging. Circulation: Cardiovascular Imaging 2012. 5 637–6. ( 10.1161/CIRCIMAGING.112.972588) [DOI] [PMC free article] [PubMed] [Google Scholar]
- 60.Oosterhof T, Van Straten A, Vliegen HW, Meijboom FJ, Van Dijk APJ, Spijkerboer AM, Bouma BJ, Zwinderman AH, Hazekamp MG, De Roos A.Preoperative thresholds for pulmonary valve replacement in patients with corrected tetralogy of Fallot using cardiovascular magnetic resonance. Circulation 2007. 116 5, 45–5. ( 10.1161/CIRCULATIONAHA.106.659664) [DOI] [PubMed] [Google Scholar]
- 61.Khalique OK, Cavalcante JL, Shah D, Guta AC, Zhan Y, Piazza N, Muraru D.Multimodality imaging of the tricuspid valve and right heart anatomy. JACC: Cardiovascular Imaging 2019. 12 516–5. ( 10.1016/j.jcmg.2019.01.006) [DOI] [PubMed] [Google Scholar]
- 62.Fukuda S, Gillinov AM, McCarthy PM, Stewart WJ, Song JM, Kihara T, Daimon M, Shin MS, Thomas JD, Shiota T.Determinants of recurrent or residual functional tricuspid regurgitation after tricuspid annuloplasty. Circulation 2006. 114 (Supplement) I582–I587. ( 10.1161/CIRCULATIONAHA.105.001305) [DOI] [PubMed] [Google Scholar]
- 63.Min SY, Song JM, Kim JH, Jang MK, Kim YJ, Song H, Kim DH, Lee JW, Kang DH, Song JK.Geometric changes after tricuspid annuloplasty and predictors of residual tricuspid regurgitation: a real-time three-dimensional echocardiography study. European Heart Journal 2010. 31 2871–28. ( 10.1093/eurheartj/ehq227) [DOI] [PubMed] [Google Scholar]
- 64.Galiè N, Hoeper MM, Humbert M, Torbicki A, Vachiery JL, Barbera JA, Beghetti M, Corris P, Gaine S, Gibbs JSet al. Guidelines for the diagnosis and treatment of pulmonary hypertension: the task force for the diagnosis and treatment of pulmonary hypertension of the European Society of Cardiology (ESC) and the European Respiratory Society (ERS), endorsed by the International Society of Heart and Lung Transplantation (ISHLT). European Heart Journal 2009. 30 2493–2. ( 10.1093/eurheartj/ehp297) [DOI] [PubMed] [Google Scholar]
- 65.Renella P, Aboulhosn J, Lohan DG, Jonnala P, Finn JP, Satou GM, Williams RJ, Child JS.Two-dimensional and Doppler echocardiography reliably predict severe pulmonary regurgitation as quantified by cardiac magnetic resonance. Journal of the American Society of Echocardiography 2010. 23 880–88. ( 10.1016/j.echo.2010.05.019) [DOI] [PubMed] [Google Scholar]
- 66.Puchalski MD, Askovich B, Sower CT, Williams RV, Minich LLA, Tani LY.Pulmonary regurgitation: determining severity by echocardiography and magnetic resonance imaging. Congenital Heart Disease 2008. 3 168–1. ( 10.1111/j.1747-0803.2008.00184.x) [DOI] [PubMed] [Google Scholar]
- 67.Pothineni KR, Wells BJ, Hsiung MC, Nanda NC, Yelamanchili P, Suwanjutah T, Prasad ANR, Hansalia S, Lin CC, Yin WHet al. Live/real time three-dimensional transthoracic echocardiographic assessment of pulmonary regurgitation. Echocardiography 2008. 25 911–91. ( 10.1111/j.1540-8175.2008.00721.x) [DOI] [PubMed] [Google Scholar]
- 68.Van Berendoncks A, Van Grootel R, McGhie J, van Kranenburg M, Menting M, Cuypers JAAE, Bogers AJJC, Witsenburg M, Roos-Hesselink JW, van den Bosch AE.Echocardiographic parameters of severe pulmonary regurgitation after surgical repair of tetralogy of Fallot. Congenital Heart Disease 2019. 14 628–6. ( 10.1111/chd.12762) [DOI] [PMC free article] [PubMed] [Google Scholar]
- 69.Augustine DX, Coates-Bradshaw LD, Willis J, Harkness A, Ring L, Grapsa J, Coghlan G, Kaye N, Oxborough D, Robinson Set al. Echocardiographic assessment of pulmonary hypertension: a guideline protocol from the British Society of Echocardiography. Echo Research and Practice 2018. 5 G11–G. ( 10.1530/ERP-17-0071) [DOI] [PMC free article] [PubMed] [Google Scholar]
- 70.Silversides CK, Veldtman GR, Crossin J, Merchant N, Webb GD, McCrindle BW, Siu SC, Therrien J.Pressure half-time predicts hemodynamically significant pulmonary regurgitation in adult patients with repaired tetralogy of Fallot. Journal of the American Society of Echocardiography 2003. 16 1057–10. ( 10.1016/S0894-7317(0300553-4) [DOI] [PubMed] [Google Scholar]
- 71.Lang RM, Badano LP, Victor MA, Afilalo J, Armstrong A, Ernande L, Flachskampf FA, Foster E, Goldstein SA, Kuznetsova Tet al. Recommendations for cardiac chamber quantification by echocardiography in adults: an update from the American Society of Echocardiography and the European Association of Cardiovascular Imaging. Journal of the American Society of Echocardiography 2015. 28 1.e14–39.e14. ( 10.1016/j.echo.2014.10.003) [DOI] [PubMed] [Google Scholar]
- 72.Fawzy ME, Mercer EN, Dunn B, Al-Amri M, Andaya W.Doppler echocardiography in the evaluation of tricuspid stenosis. European Heart Journal 1989. 10 985–9. ( 10.1093/oxfordjournals.eurheartj.a059423) [DOI] [PubMed] [Google Scholar]
Associated Data
This section collects any data citations, data availability statements, or supplementary materials included in this article.


 This work is licensed under a


