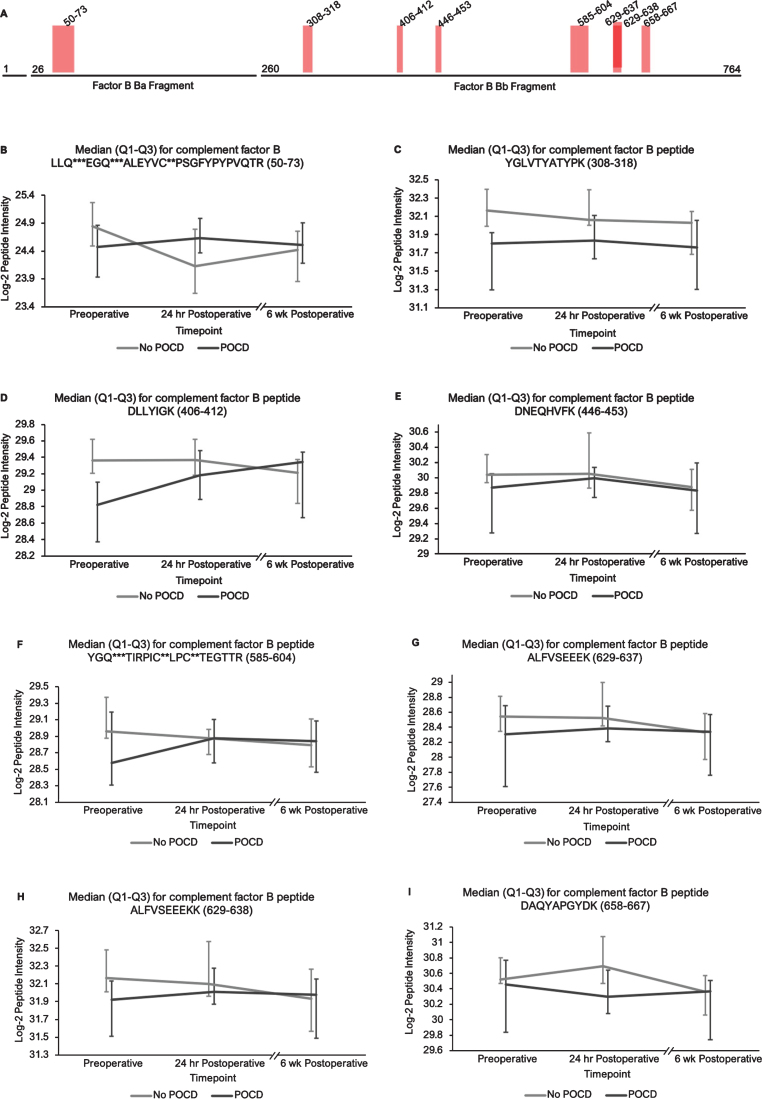
Fig. 4.
Complement factor B peptide locations and intensity trends. A) A map of complement factor B showing the locations of its eight peptides with q < 0.25 in the linear mixed model. Seven of the eight peptides represent portions of its Bb fragment. B-I) Graphs comparing median factor b peptide intensities between POCD and non-POCD groups across all three time points. Vertical bars represent interquartile range. Post-translational modifications: *Deamidation, **Carbamidomethylation, ***Oxidation.

