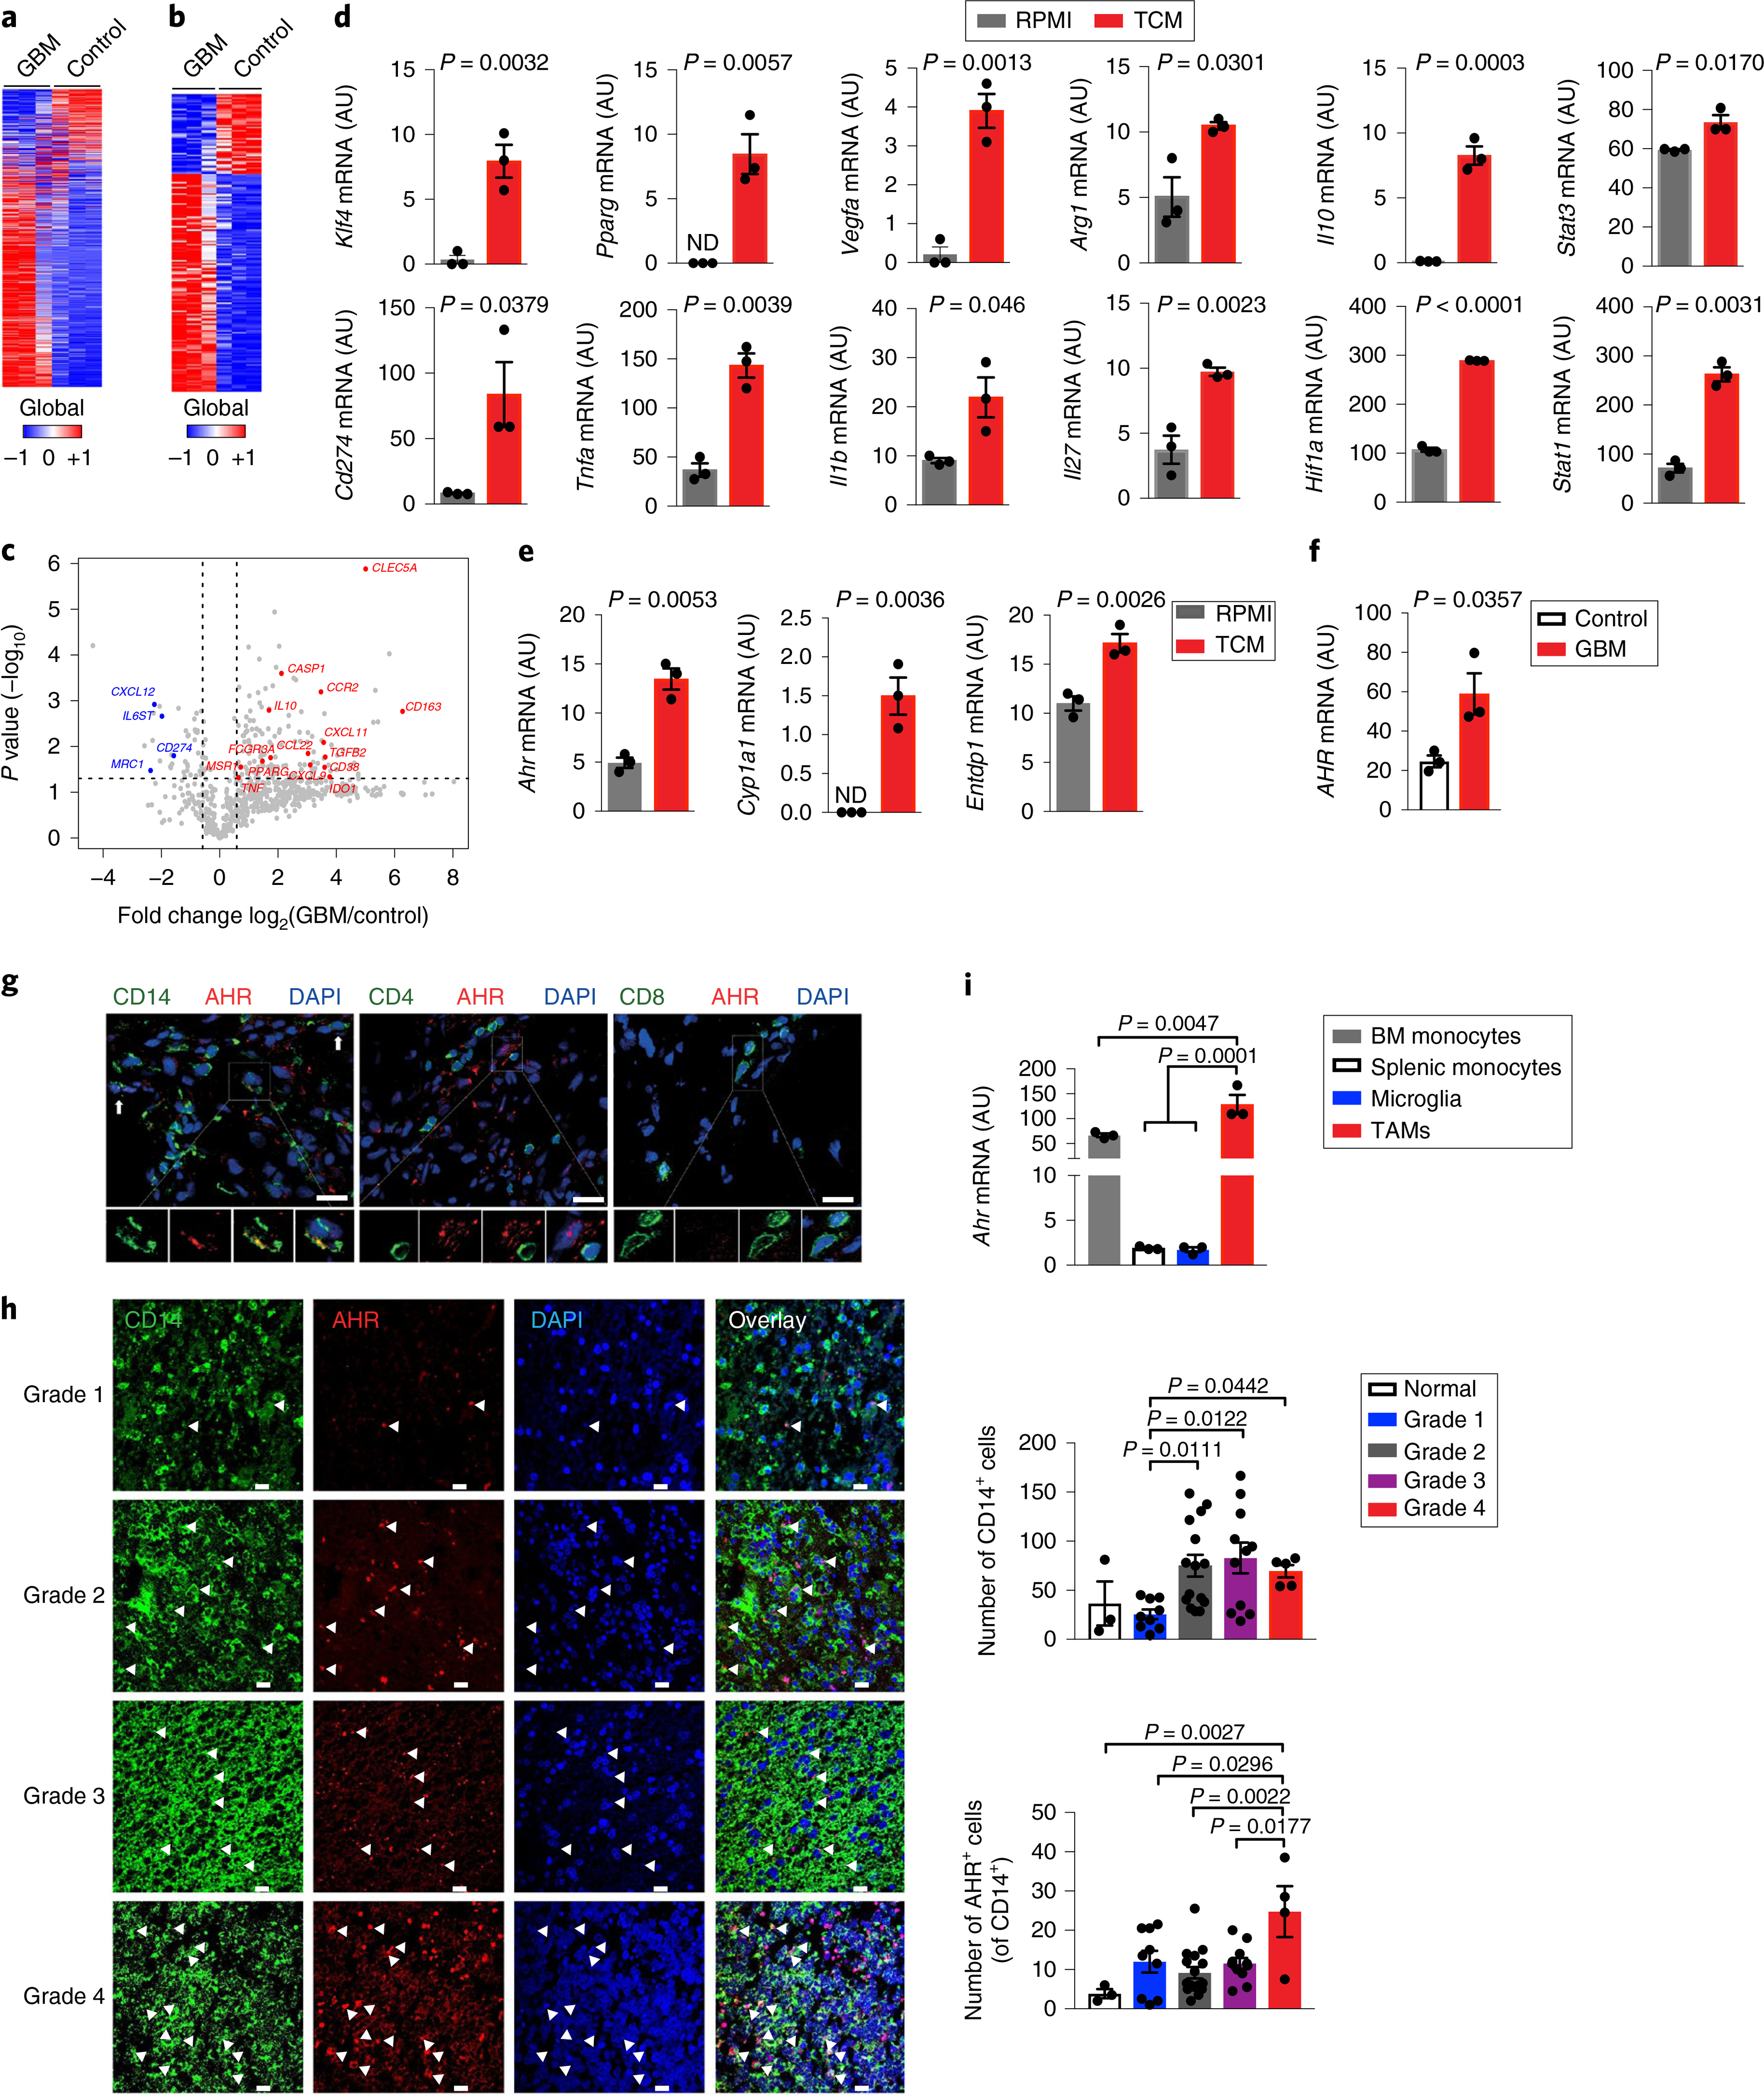
Fig. 1 |. AHR is expressed by TAMs in GBM.

a–c, Gene expression analysis of GBM-infiltrating CD14+ cells (GBM) and microglia from healthy individuals (Control) using Nanostring (n = 3 biologically independent samples). Heatmap of all expressed genes (a), differentially regulated genes with P < 0.05 (b) and volcano plot of gene expression with P < 0.05 (fold change in relative expression of M1-like and M2-like genes as determined by log2 (GBM/control), with upregulated genes are shown in red and downregulated genes in blue) (c). d,e, Sorted splenic macrophages (CD11cNeg CD11b+ Ly6C+) stimulated with complete RPMI (RPMI) or TCM from GL261 cells for 24 h. Quantitative PCR (qPCR) analysis of M1- and M2-linked genes (d) and of Ahr and AHR target genes (n = 3 technical replicates) (e). Data are representative of three independent experiments, with similar results obtained. ND, not detectable. f, AHR expression in GBM and Control cells (n = 3 biologically independent samples) determined by qPCR. g, Representative immunofluorescence images of human GBM stained for AHR (red), CD14 (green), CD4 (green), CD8 (green) and nuclei (DAPI; blue) (n = 3 biologically independent samples). Arrows indicate co-expression of AHR and CD14. Scale bars, 25 μm. h, Left: representative immunofluorescence images of human gliomas stained for AHR (red), CD14 (green) and nuclei (blue) from a nervous system glioma tissue array (n = 43). Arrowheads indicate co-expression of AHR and CD14. Scale bars, 20 μm. Right: quantification of the total number of CD14+ cells and AHR+ CD14+ cells in 40 glioma samples and 3 controls. Kruskal–Wallis test was used for statistical analysis. i, Ahr expression in microglia (CD45Low CD11b+), bone marrow (BM) monocytes (CD3Neg B220Neg Ly6GNeg NK1.1Neg Siglec-FNeg CD11b+ Ly6CHi) and splenic monocytes (CD11cNeg CD11b+ Ly6CHi) from naive wild-type (WT) mice and TAMs (LinNeg CD45+ CD11b+) in GL261-bearing WT mice (n = 3 biologically independent samples). Data are representative of three independent experiments, with similar results obtained. Data in d–f, h and i are shown as mean ± s.e.m. P values were determined using two-sided Student’s t-tests (b–f) or one-way ANOVA (i).
