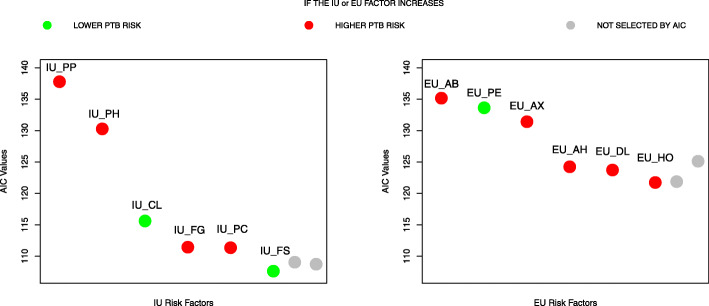
Fig. 2.
Akaike Information Criterion (AIC) Model Selection for intrauterine (IU) and extrauterine (EU) risk factors. Forward selection of both IU and EU most representative risk factors by AIC. On the x-axis we display the labels of the risk factors entered with respect to the order of Table 3; on the y-axis the AIC values. Each point on the graph represents the AIC value scored by a model composed by all the risk factors on the left of the point (including the label above the point). The green color represents a decrease in the expected preterm birth risk whenever the specific risk factor augments holding the other variables constant at a certain value (e.g. increasing the cervical length IU_CL leads to a lower expected risk of preterm birth). For dichotomous variables, the variation is from absence to presence (e.g. for EU_PE, doing physical exercise decrease the expected preterm birth risk). In the specific case of IU_FS (Fetal Sex), the variation is from male to female. On the other hand, the red color represents an increase in the expected preterm birth risk whenever a specific dichotomous risk factor becomes active holding the other variables constant at a certain value (e.g. for EU_AB, giving antibiotics leads to an expected increase of the preterm birth risk). Both colors directly reflect the signs of the beta coefficients associated to each risk factor in the specific logistic regression model. Finally the grey colored points represent other possible risk factors that were not added because the criterion had already reached its minimum

