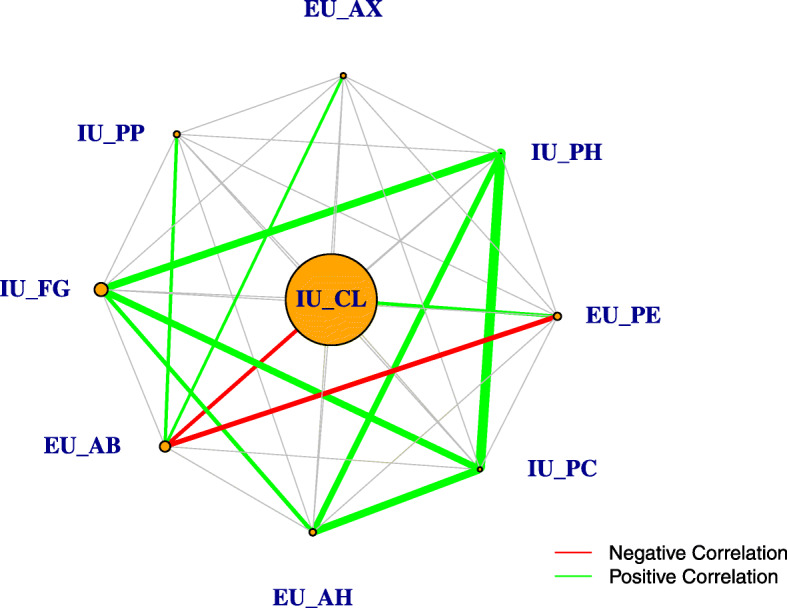
Fig. 5.

Variable importance network for the risk factors selected by Akaike Information Criterion (AIC). We build a network from the variable importance ([96] ch.15) of a random forest trained on the subset of 9 risk factors determined by AIC in the explanatory phase. The size of each vertex is proportional to the average variable importance while each edge represents the Pearson correlation coefficient between the two risk factors. In addition, the thickness of each edge is proportional to the strength of the correlation and colored edges imply a significant (i.e. pvalue<0.05) relationship either negative (red edge) or positive (green edge)
