Fig. 2.
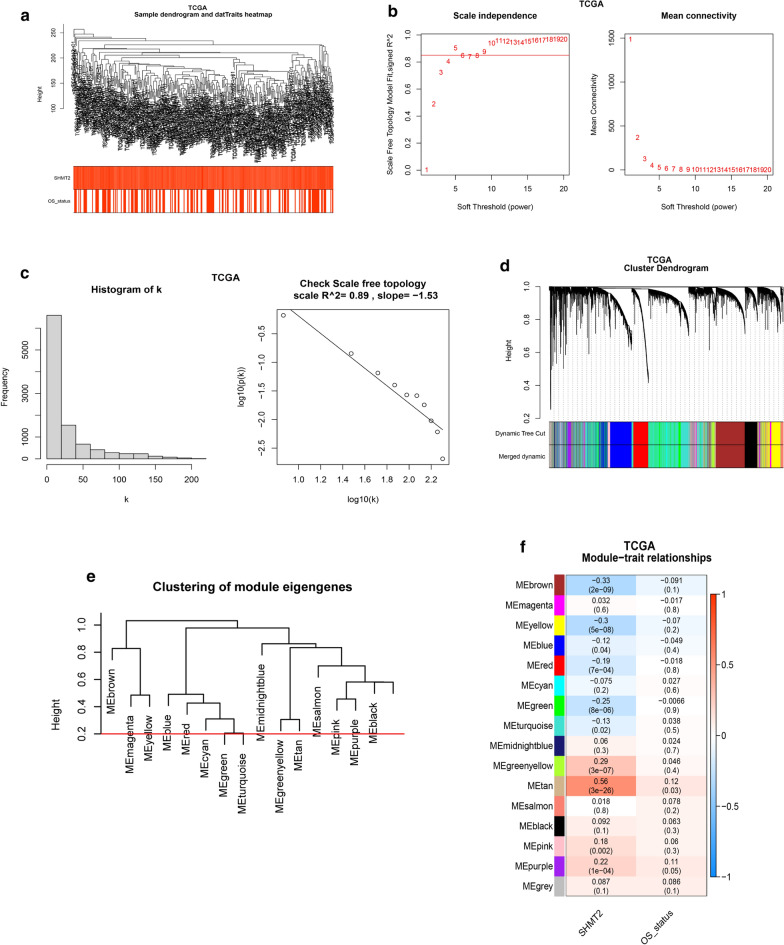
Construction of weighted co-expression network and identification of the key module. a Hierarchical clustering dendrogram of samples in TCGA database (n = 306). b Analysis of the scale free fit index and the mean connectivity for various soft threshold power. c Scale free topology test based on β = 5. d Cluster dendrogram of genes with dissimilarity based on topological overlap. Branches of the clustering tree represent merged modules, and different colors correspond to different modules. e Cluster dendrogram of module eigengenes: modules below the red line (0.2) are merged. f Correlation coefficient and p-value for module-trait relationships. Each row is a module eigengene

