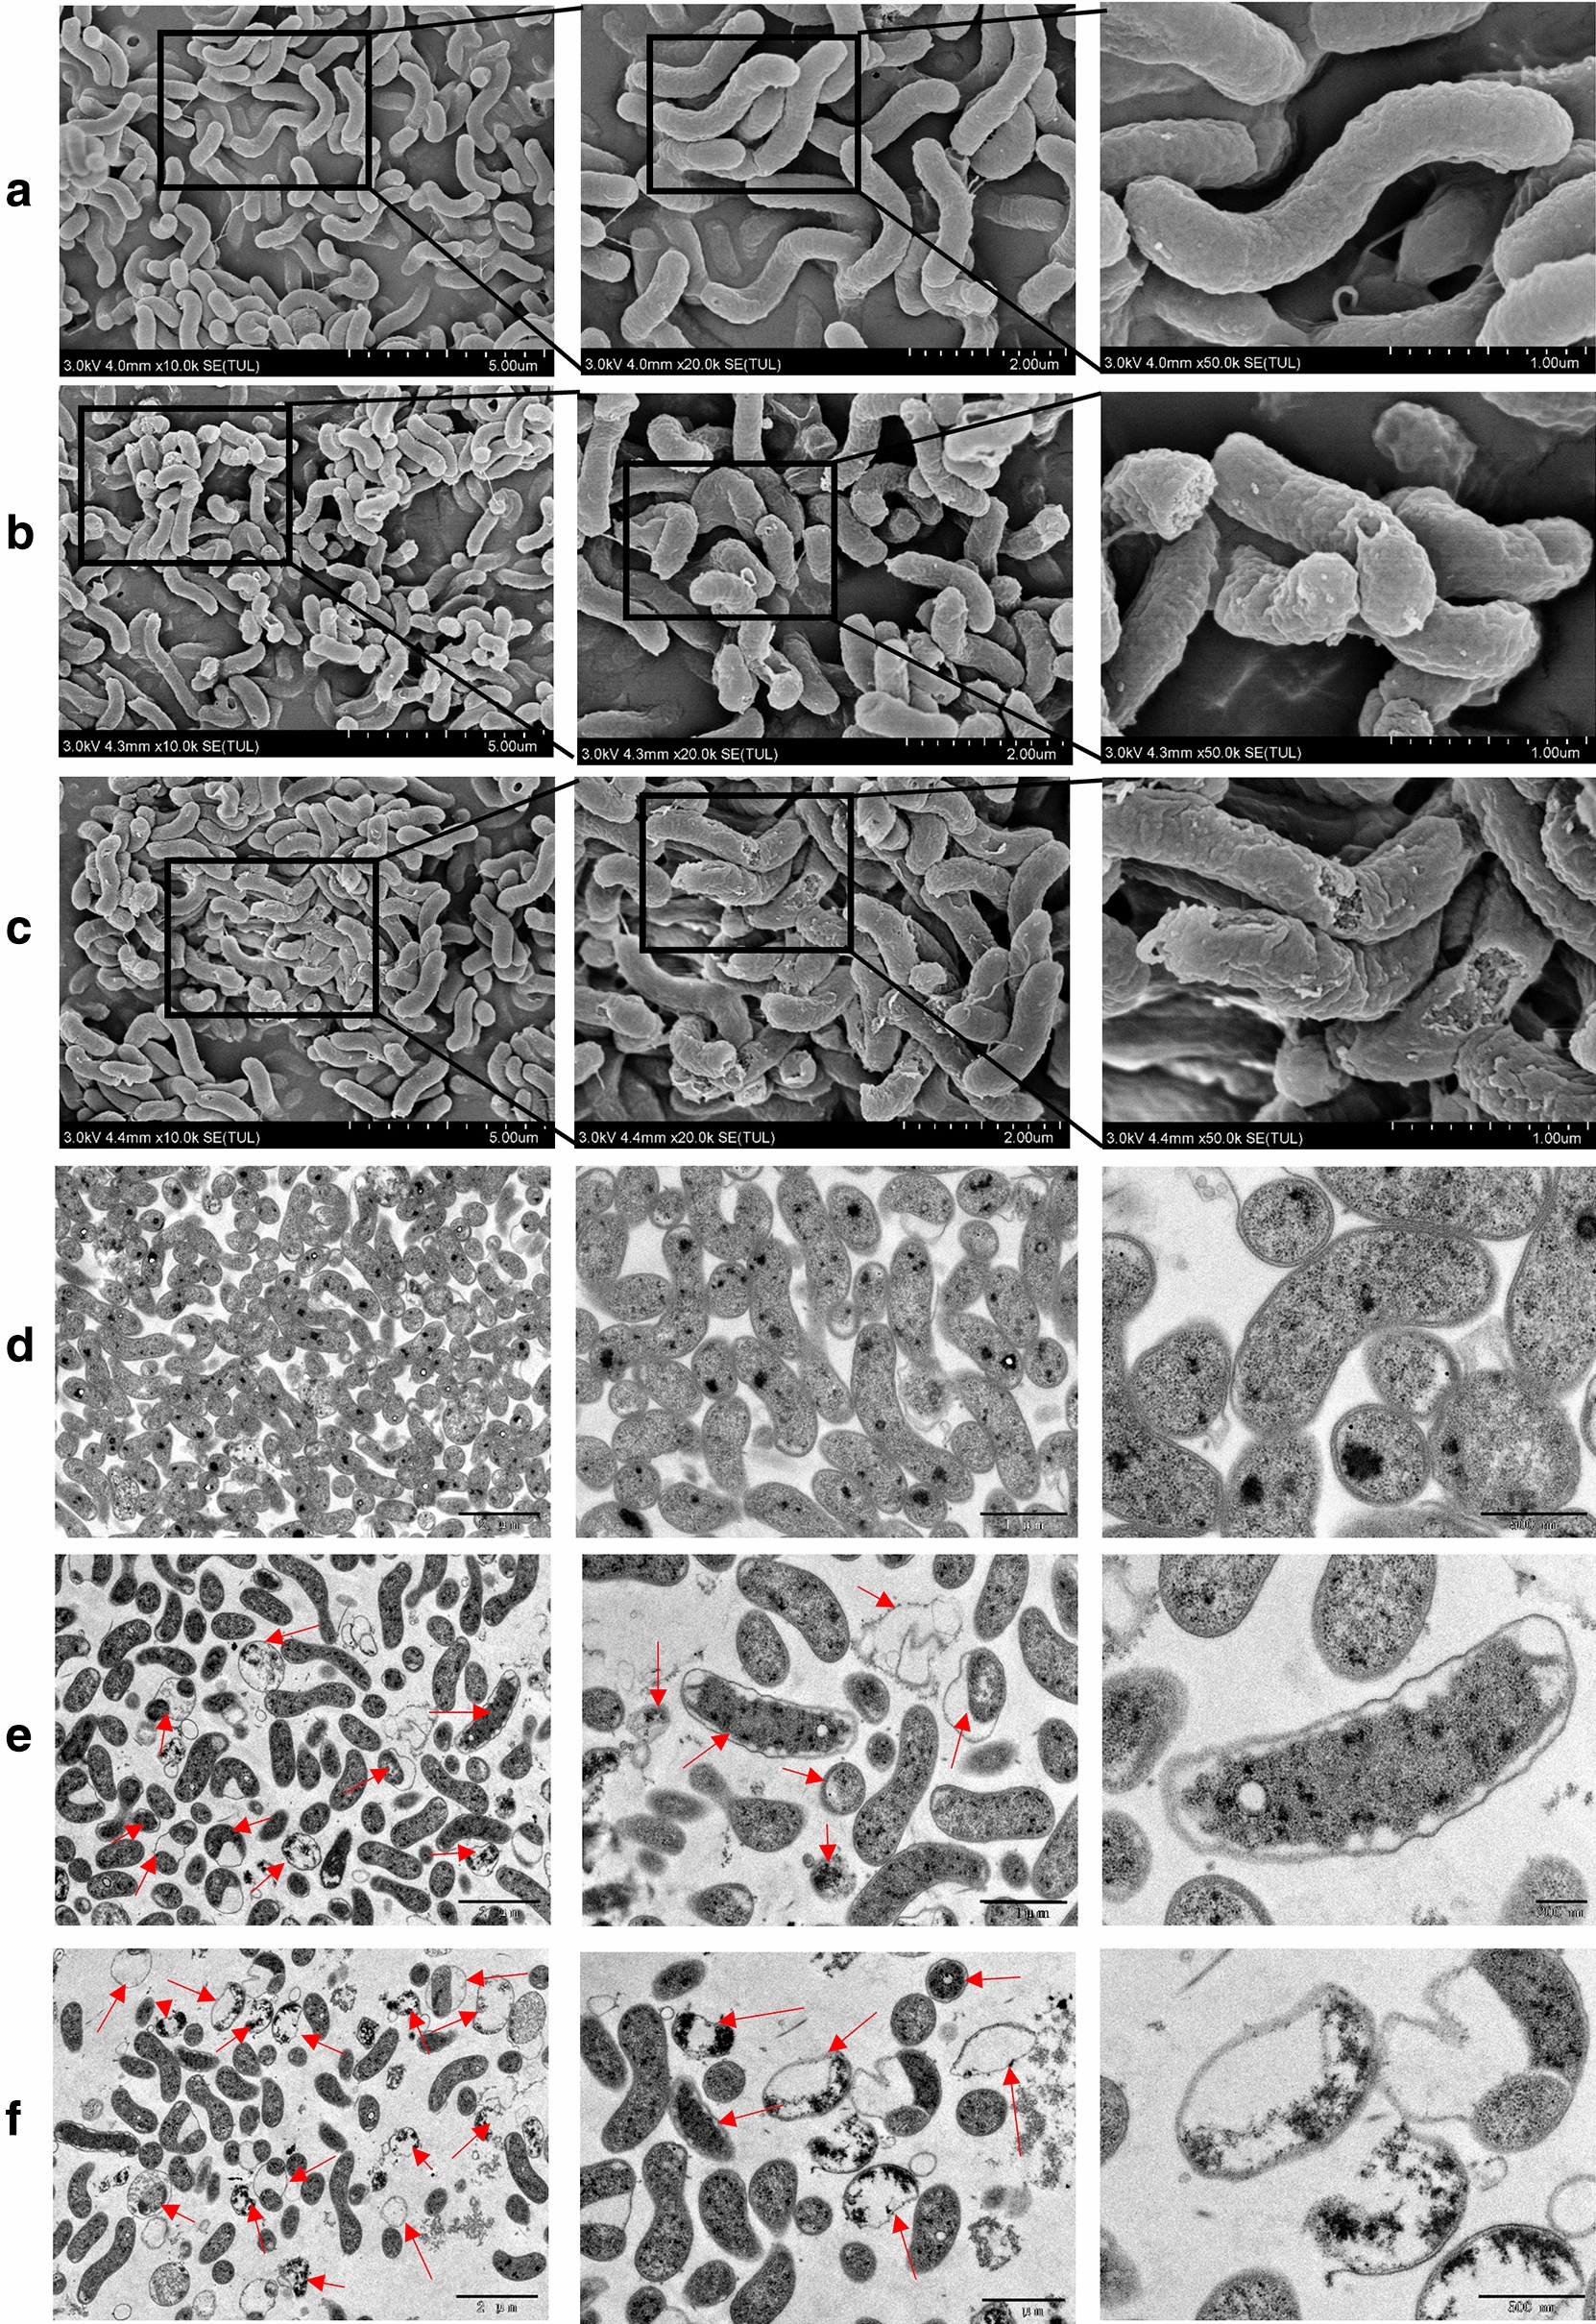
Fig. 3.

Scanning electron microscopy (SEM) and transmission electron microscopy (TEM) images. a–c Morphological images of H. pylori cells on SEM after exposure to water, 2 MIC S. officinalis, and 4 MIC S. officinalis for 12 h. Each result is shown at three different scales. These results indicate that treatment of S. officinalis can result in cell shrinkage and cell wall damage in a dose-dependent manner. d-f Morphological images of H. pylori cells on TEM after exposure to water, 2 MIC S. officinalis, and 4 MIC S. officinalis for 12 h. Each result is shown at three different scales. Red arrows indicate separation between the cell wall and inner membrane, bleb formation, cell wall damage, and cell lysis. There only existed mild cellular damage at the concentration of 2 MIC S. officinalis, mainly separation between the cell wall and inner membrane and bleb formation. There appear significant cell wall damages and cell lysis at the concentration of 4 MIC S. officinalis
