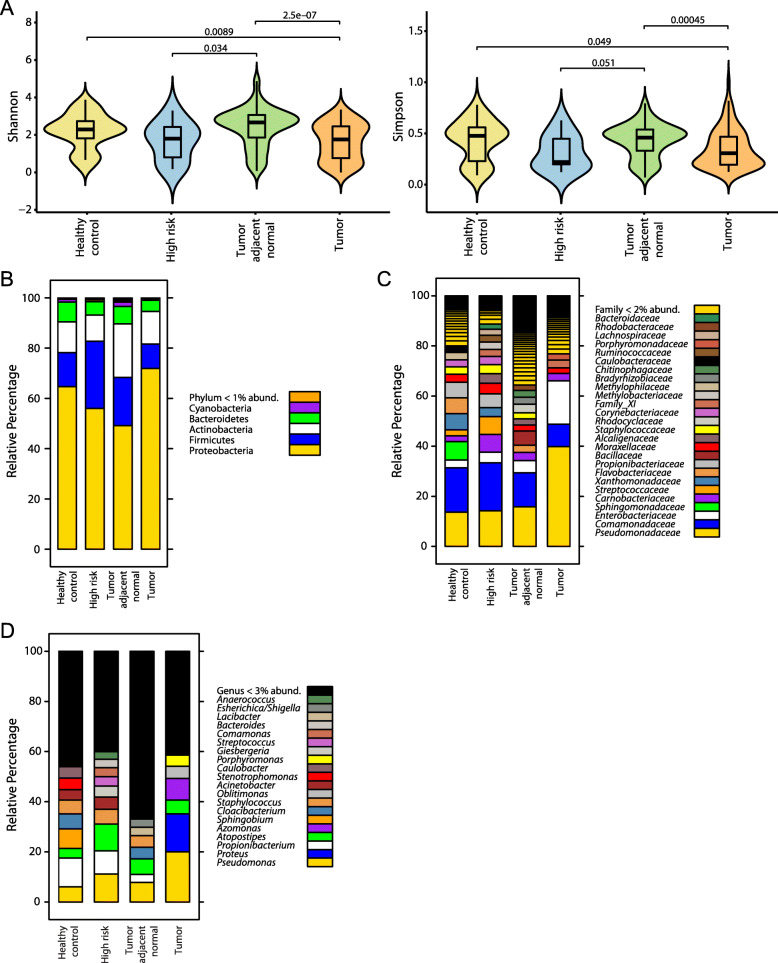
Fig. 1.
Breast bacterial community composition varies by patient breast cancer status and tissue type. a Bacterial α-diversity as measured by Shannon and Simpson diversity indices within breast tissue from patients with (tumor, tumor adjacent normal) versus without (healthy control, high-risk) breast cancer. Violin plots show median and interquartile range. p-values result from one-way ANOVA tests. Taxonomic composition of the breast microbiome, depicted as average relative abundances at the phylum (b), family (c), and genus (d) levels for each tissue type

