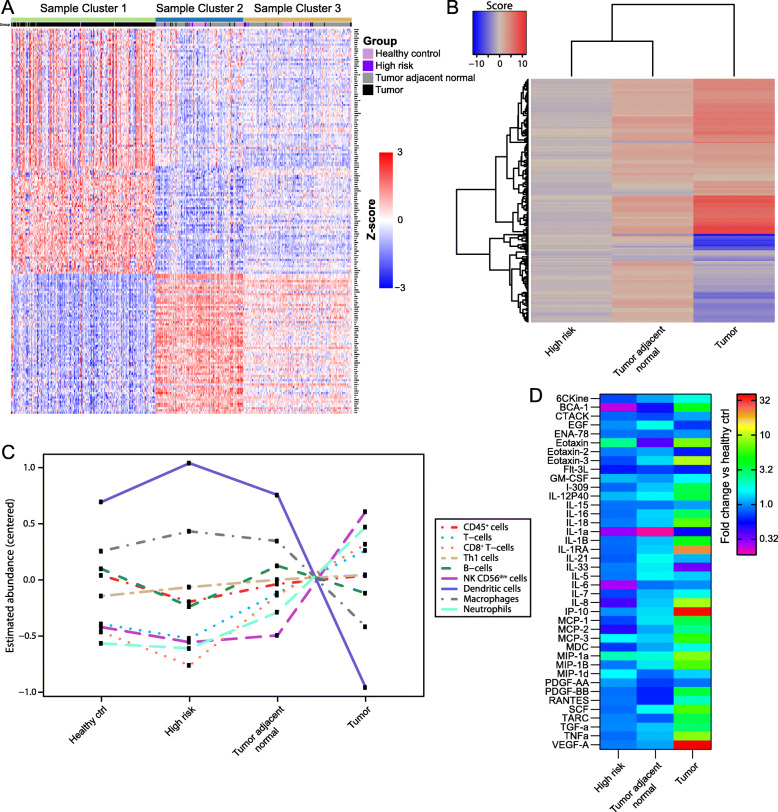
Fig. 4.
Breast tumor tissue exhibits a distinct immunological signature. a K-means clustering (k = 3) of 443 breast tissue samples by expression levels of immune-related genes as measured by NanoString. Genes with the greatest differential expression between tumor and healthy controls are shown (|fold change| > 2 and FDR < 0.05; n = 179 genes). Rows represent individual genes (log2 count normalized to standard deviations from the mean), and columns represent individual tissue samples. Cluster 1 is strongly enriched for tumor tissue. b Heatmap of directed global significance scores based on NanoString data showing 164 cellular pathways whose genes were overexpressed (red) or underexpressed (blue) in the indicated tissue type relative to healthy control tissue. c Estimated abundance of immune cell subsets in each tissue type based on stably expressed, specific marker genes present in the NanoString CodeSet. Abundance estimates are reported as the average log2 counts of marker genes for each cell subset that has been centered to have mean value 0; each unit increase corresponds to a doubling in abundance. d Cytokines present at significantly different levels in the indicated tissue types relative to healthy control tissue as measured by Milliplex assay (p < 0.05 by 2-way ANOVA with posthoc Tukey test; n = 40 cytokines). Color bar varies on a logarithmic scale

