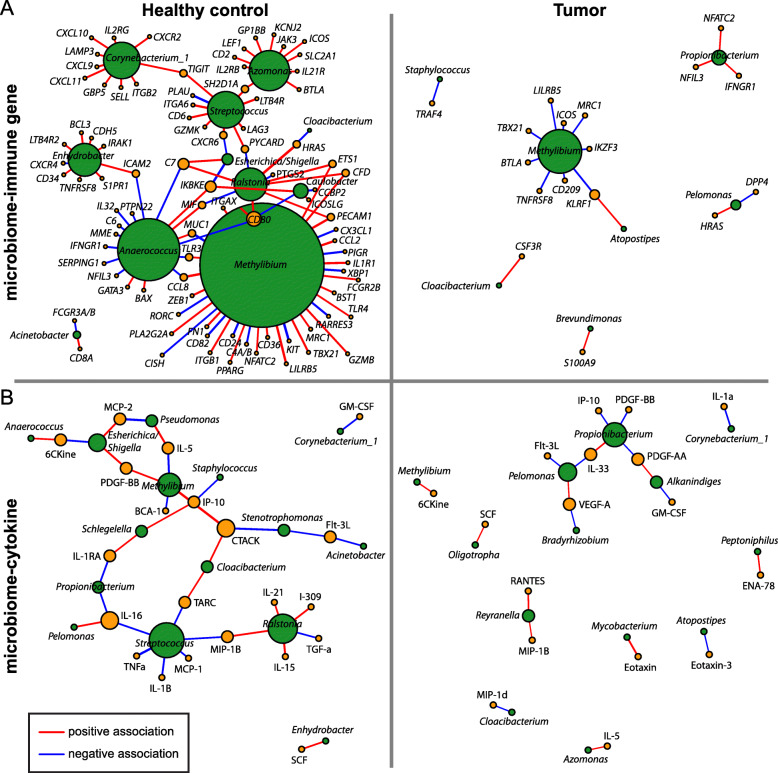
Fig. 5.
Network analyses reveal microbiome–immune associations in healthy control and tumor breast tissues. Visualization of significant microbiome associations with immune gene (a) and cytokine (b) expression based on Spearman coefficients (p < 0.05 for all associations shown). Each node corresponds to a single microbial (green) or immune (gold) feature, with node size proportional to the number of connections with other nodes. Edges (lines) between nodes depict positive (red) or negative (blue) associations, with edge width proportional to the magnitude of association

