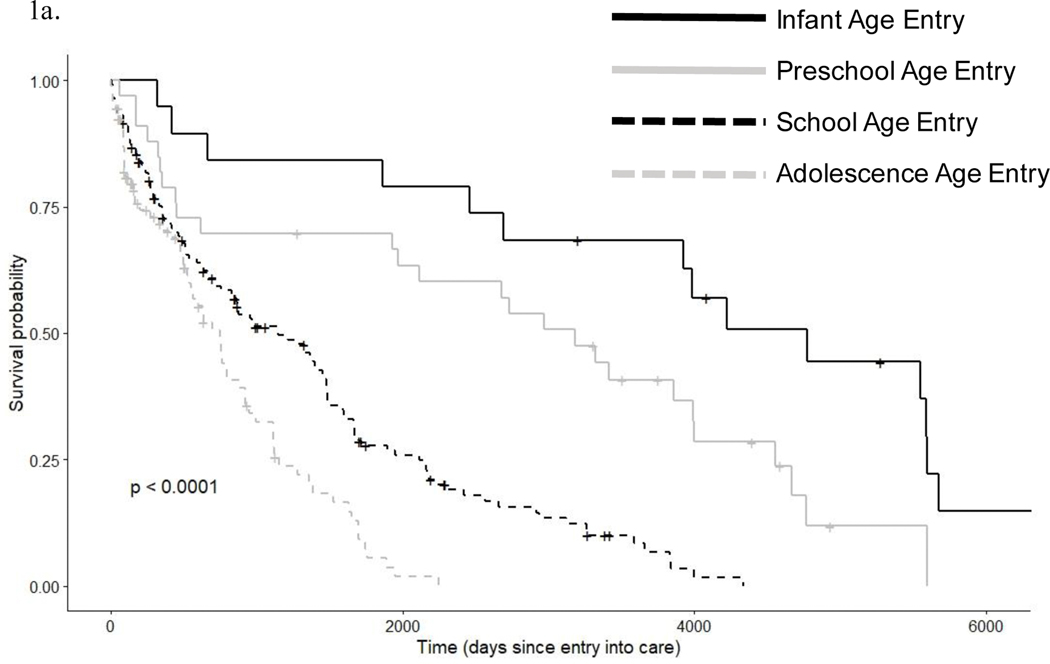
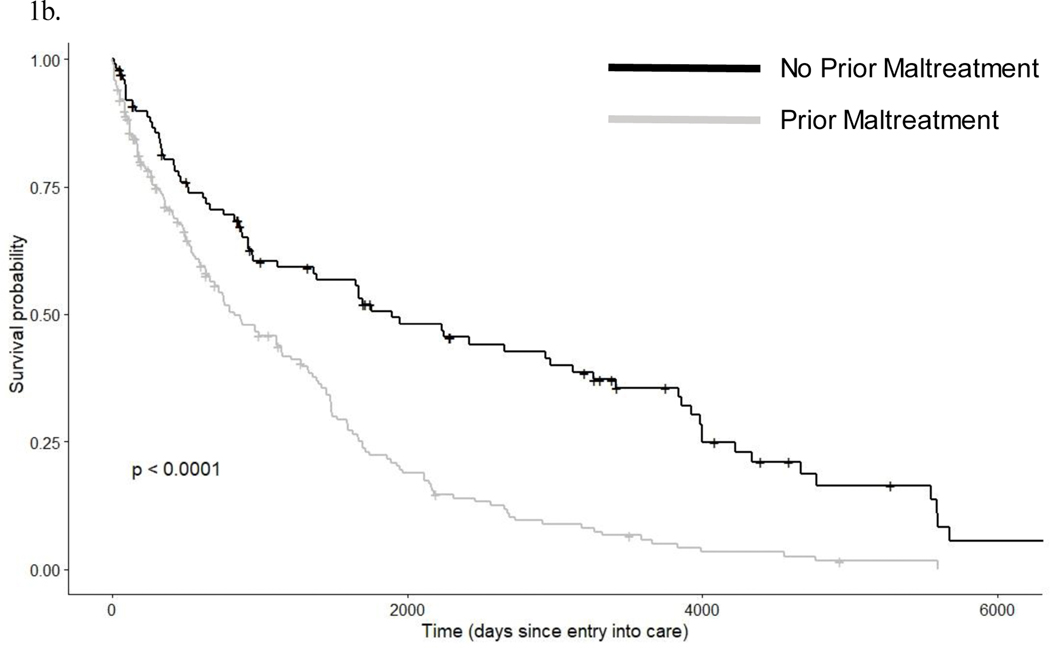
Figure 1. Survival plots from Kaplan–Meier survival analysis for grouping based on age of entry into care and maltreatment status.
Time is measured in days since first entry into care. These figures show the change in survival probability (i.e., estimated percent chance that a youth does not have a PTSD diagnosis) across time in care for age of entry into care (Figure 1a) and maltreatment status (Figure 1b). For example in Figure 1b, there is around a 50 % chance that a child who entered care with no previous history of maltreatment exposure will have a PTSD diagnosis after spending 2000 days in care.


