
Figure 2: Assembly of E. coli metagenomes from meconium samples.
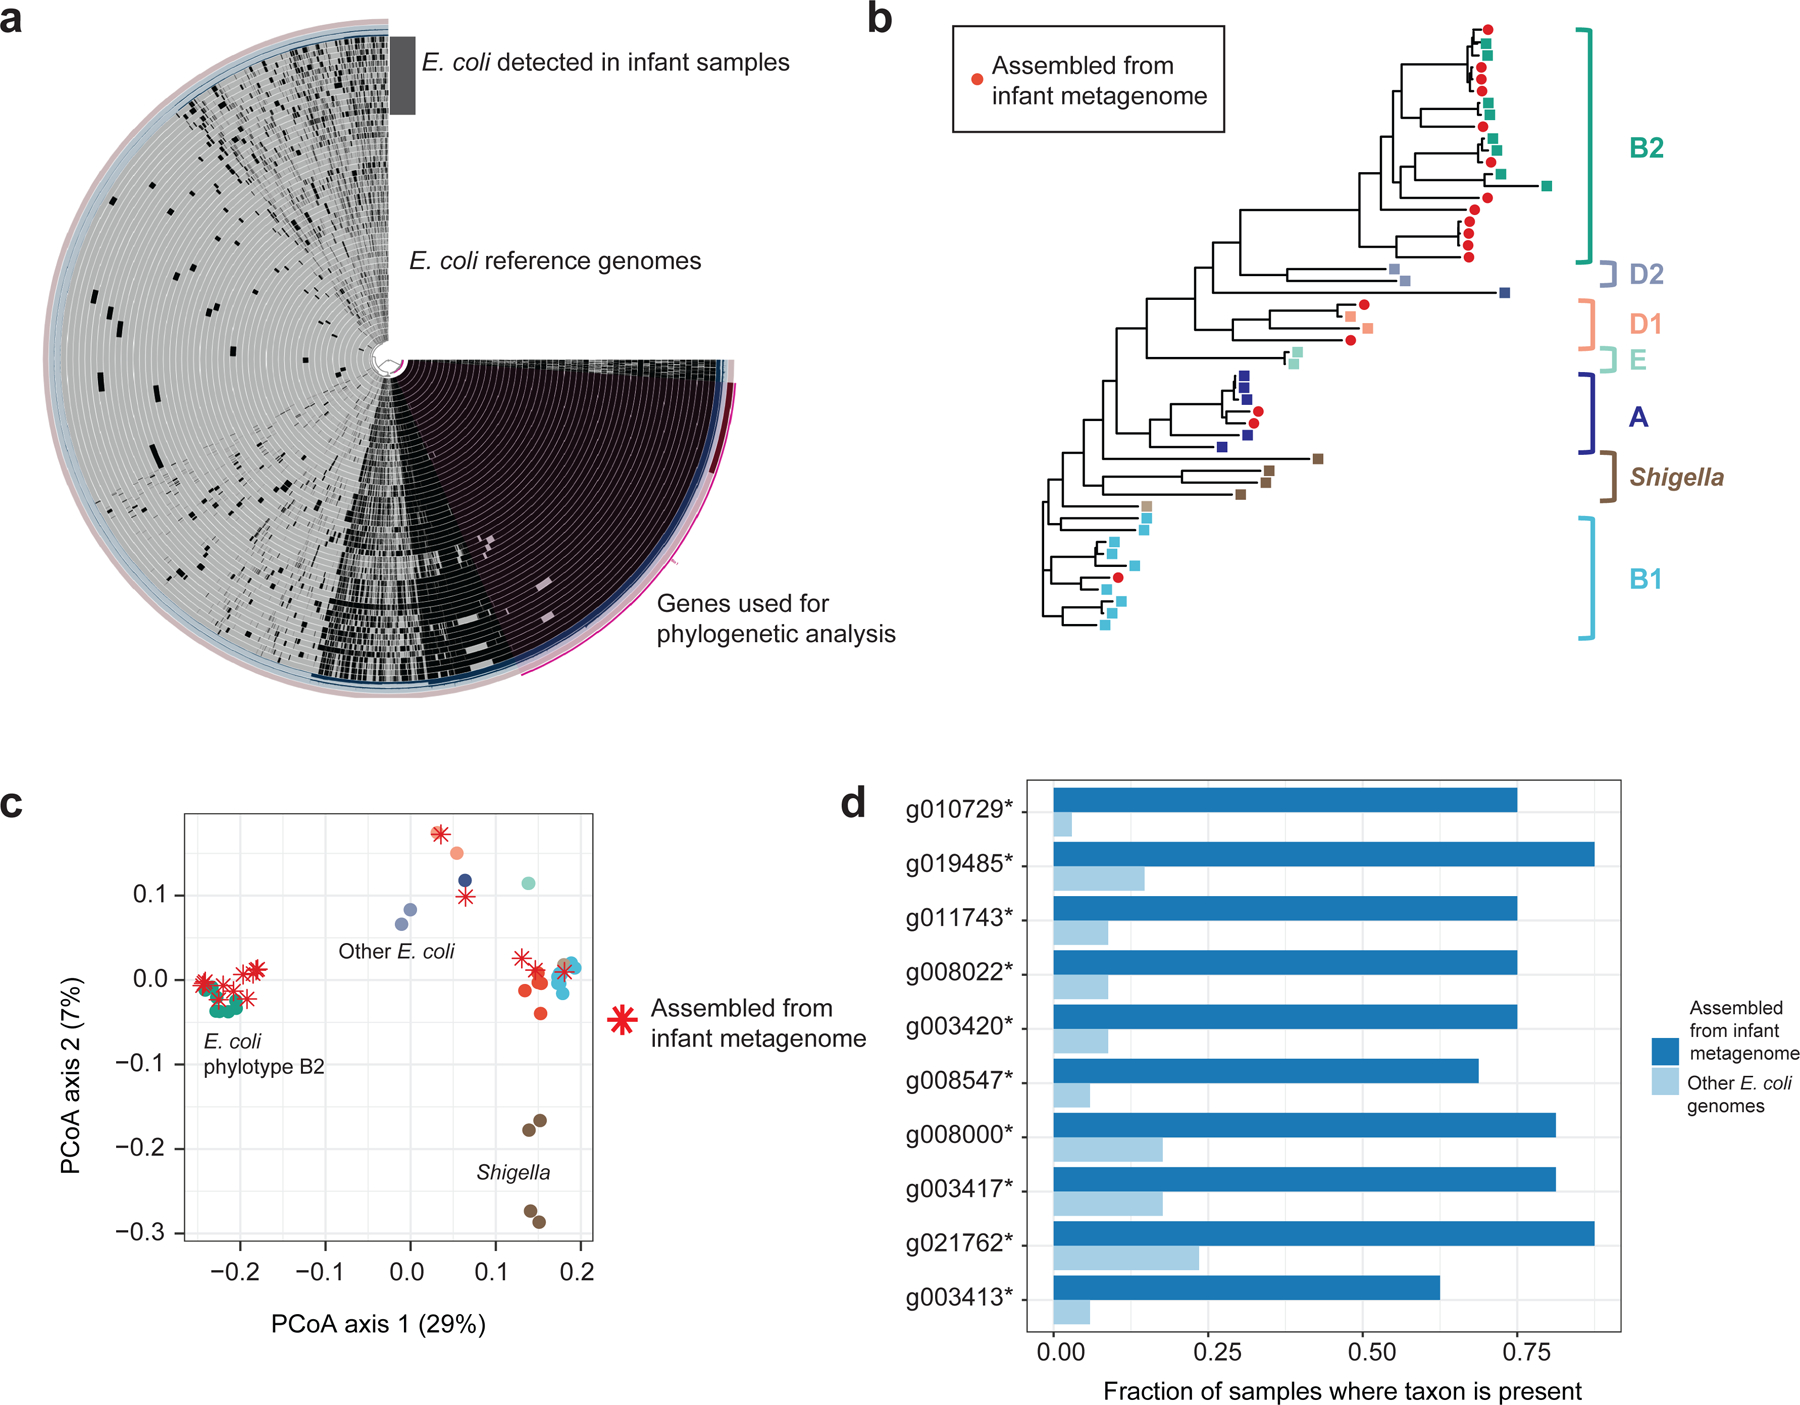
(a) Pan-genome of E. coli detected in meconium, plotted alongside E. coli reference genomes. Each genome is represented as a ring; black areas represent genes present, grey areas represent genes absent. The purple region indicates genes used in the phylogenetic analysis. (b) Phylogenetic tree of E. coli assembled from meconium, showing placement in multiple clades. (c) Principal coordinates ordination of gene content from E. coli pan-genome. (d) Genes found to be more abundant in assemblies from meconium samples. All are of unassigned function. Sample size: n1=17 genomes from this study, n2=33 reference genomes.