
Extended Data Fig. 1. Microbiota differences between birth and 1 month.
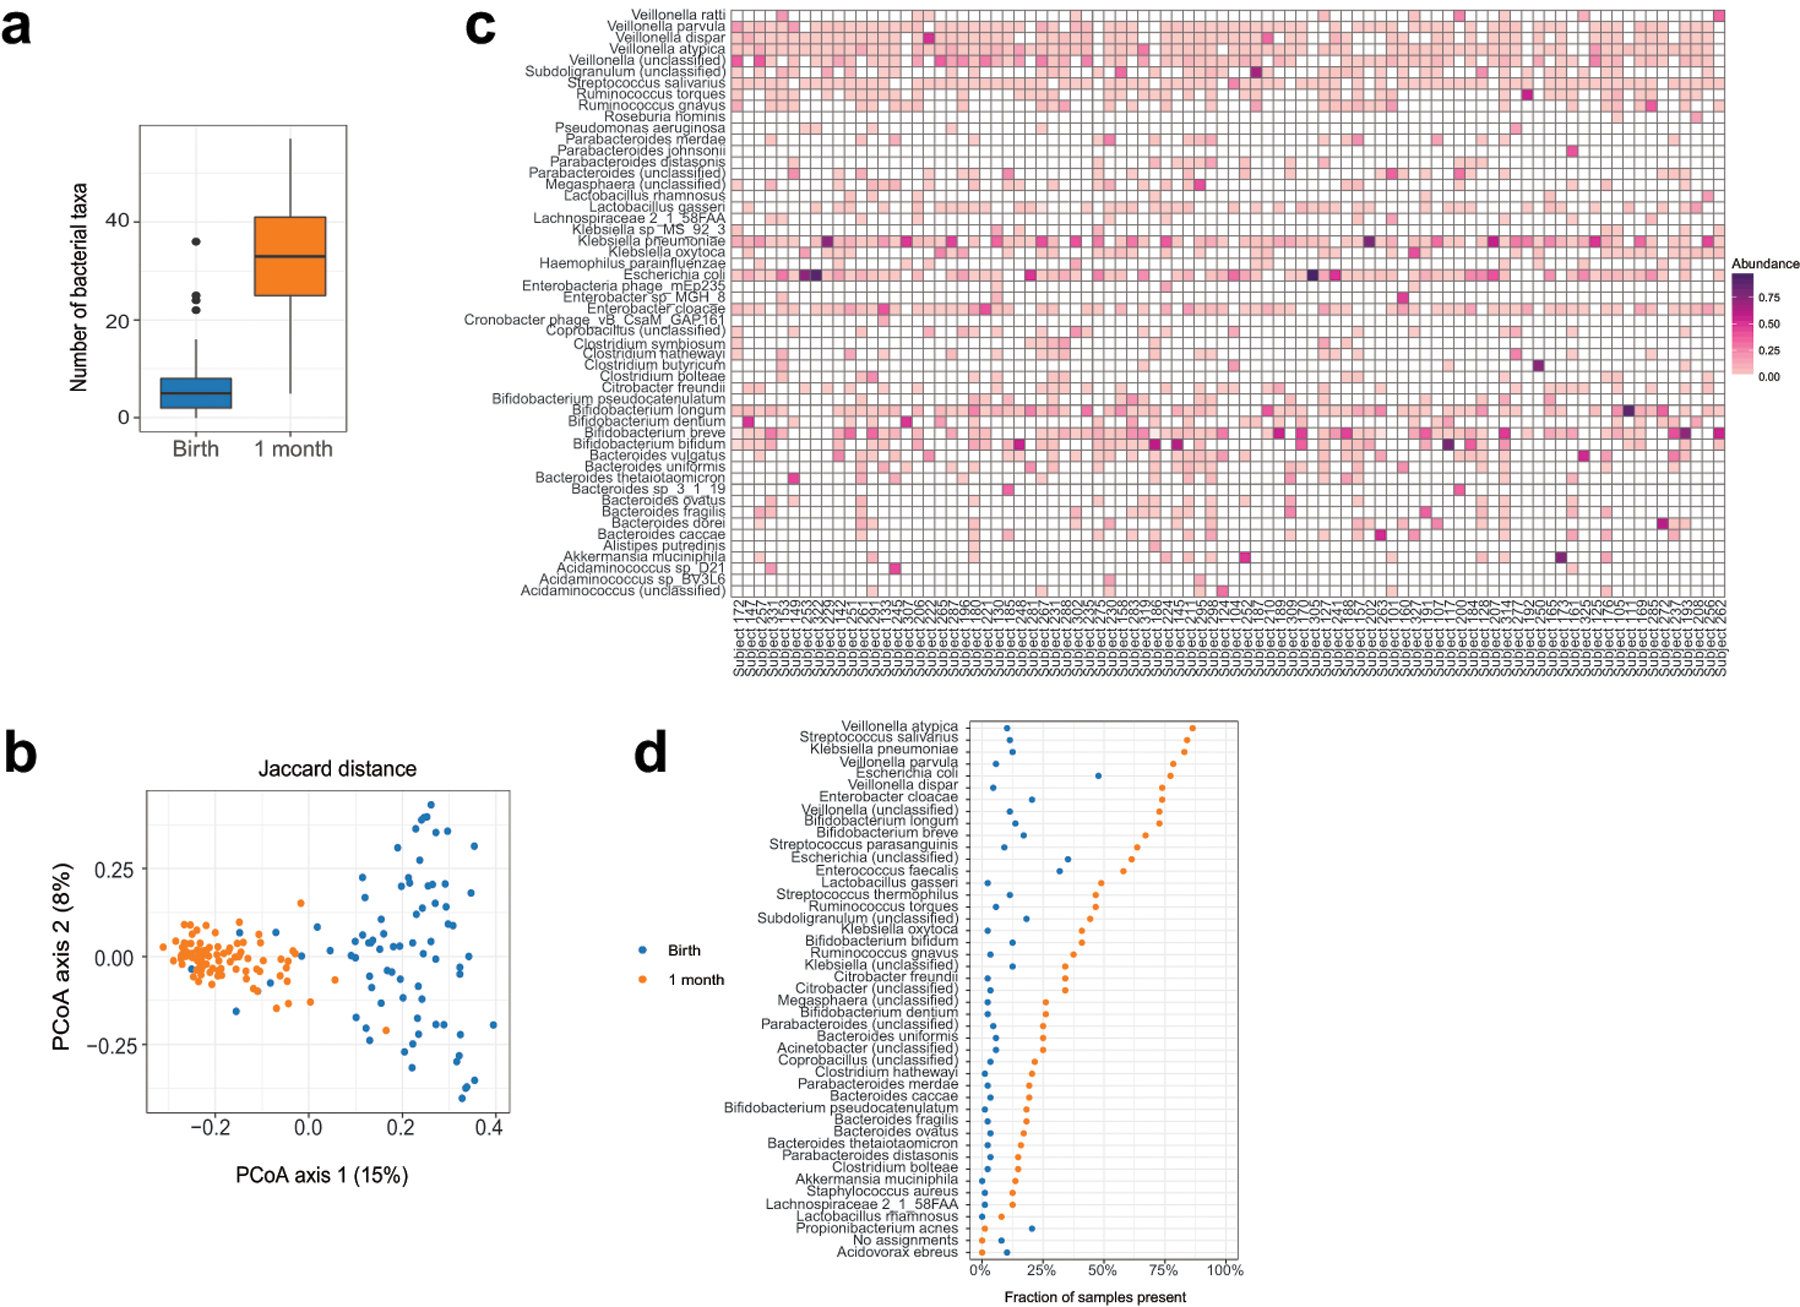
(a) The number of bacterial species increased in the 1 month samples (P = 8×10⁻¹⁶, two-sided Wilcoxon signed-rank test, n = 88 per group). Boxes indicate the median and interquartile distance, whiskers indicate maximum and minimum data points within 1.5 times the interquartile range, points represent values outside this range. (b) The identity of bacterial species was different in samples at 1 month, as quantified by Jaccard distance (R2 = 0.09, P = 0.001, PERMANOVA test with restricted permutations, n1 = 81 samples from birth, n2 = 88 samples from 1 month, 7 birth samples excluded due to no taxonomic assignments). (c) Heatmap of taxa detected in samples collected at 1 month. Taxa were included if the relative abundance was greater than 10% in any sample. (d) Prevalence of bacterial taxa in samples collected at birth and 1 month. Taxa shown were determined to be differentially present or absent by Fisher’s exact test, P < 0.05 after correction for false discovery rate (n = 88 per group, 482 taxa tested, two-sided test).