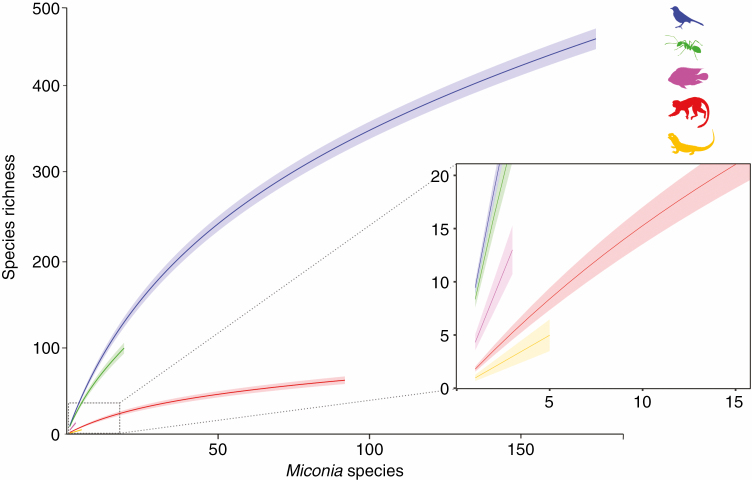
Fig. 3.
Species rarefaction curves describing the number of animal species of different clades increasing in function of Miconia species with reports of fruit consumption. Lines represent means and shaded areas the 95 % confidence interval. Blue = Aves; green = Formicidae; pink = Actinopterygii; red = Mammalia; yellow = Reptilia.

