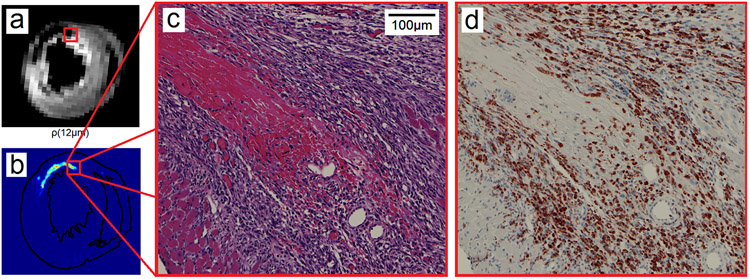
Fig. 6.
The low-value regions in the ρ(L*) mapping match well with the hemorrhagic necrosis regions in the histopathology slide. (a) The ρ(L*) mapping shows a low-value region in a rat heart with ischemia-reperfusion injury. (b) The red blood cell distribution in the H&E-stained suggests hemorrhagic necrosis in the same region. (c) The H&E image of the region shows prominent hemorrhagic necrosis with cell infiltration at the perimeter. (d) The IHC image confirms that the infiltrating cells are ED1+ macrophages. RDI can differentiate immune cell infiltration from hemorrhagic necrosis.

