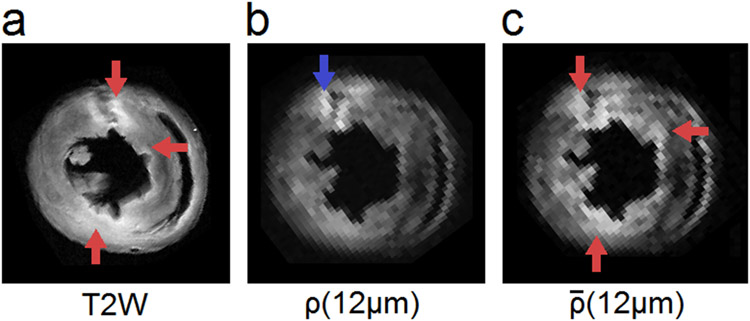
Fig. 8.
(a) T2W imaging and (b) restricted diffusion imaging compared with (c) non-restricted diffusion imaging. The restricted diffusion reveals a region with immune cell infiltration (blue arrow), whereas the non-restricted diffusion reveals regions with tissue edema (red arrows). Non-restricted diffusion allows for mapping of the edematous myocardium and provides complementary information in addition to the findings in the T2W image.

