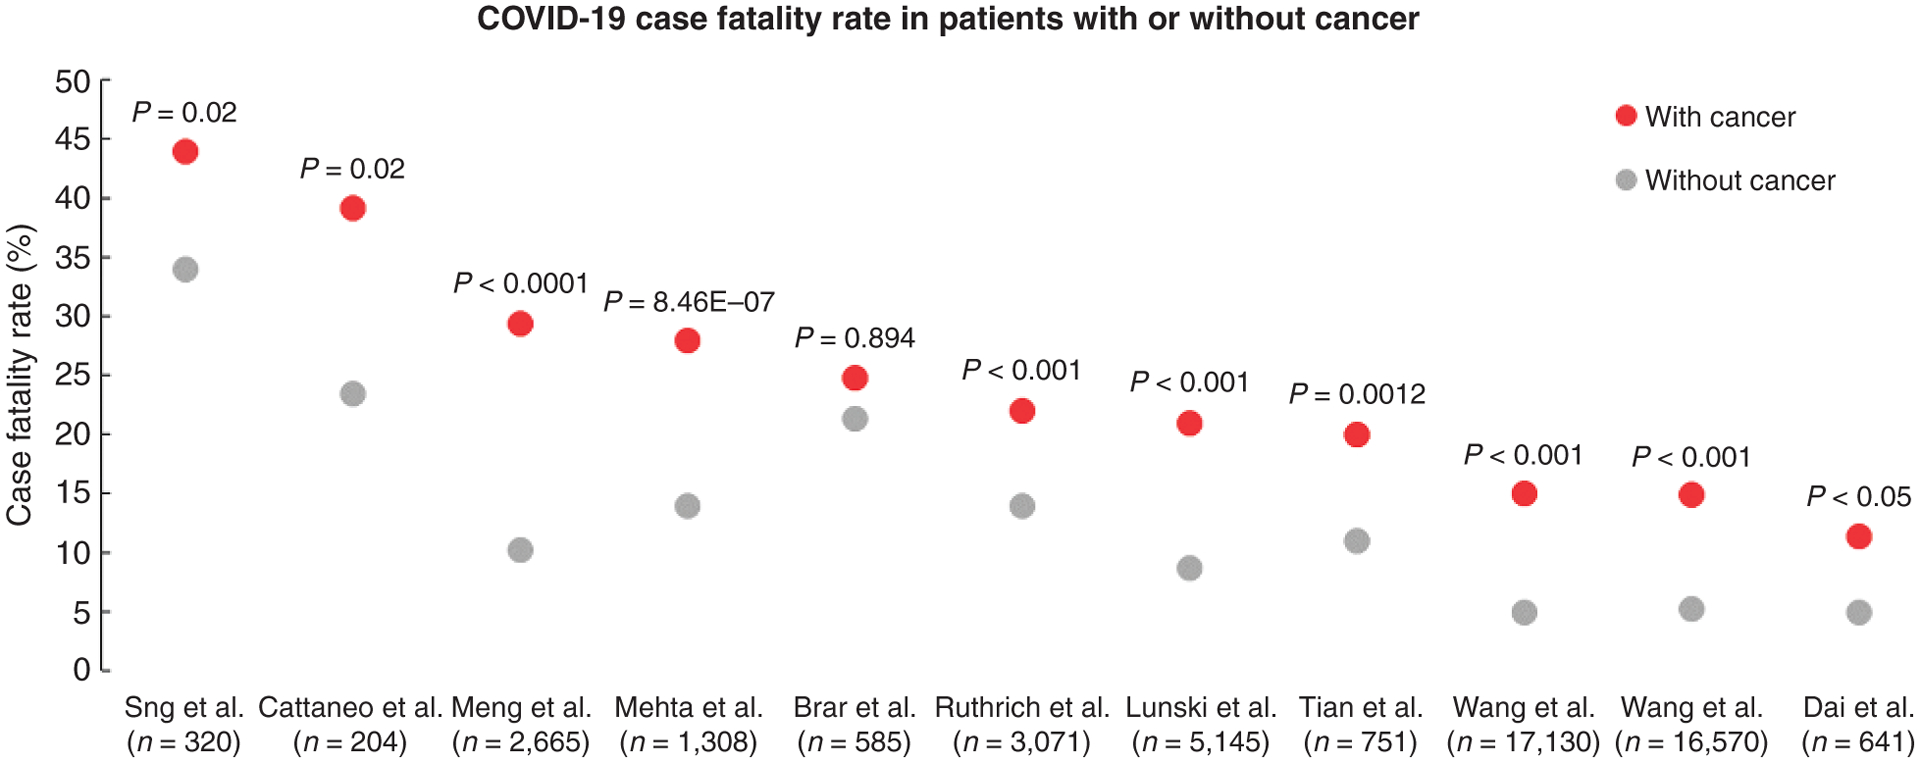
Figure 1.

Scatter plot of COVID-19–related CFRs from series comparing rates from patients with cancer (red dots) with patients without cancer (gray dots). [Series includes publications from Sng et al. (2); Cattaneo et al. (7); Meng et al. (9); Mehta et al. (11); Brar et al. (6); Ruthrich et al. (4); Lunski et al. (5); Tian et al. (10); Wang et al. (3); and Dai et al. (12)].
