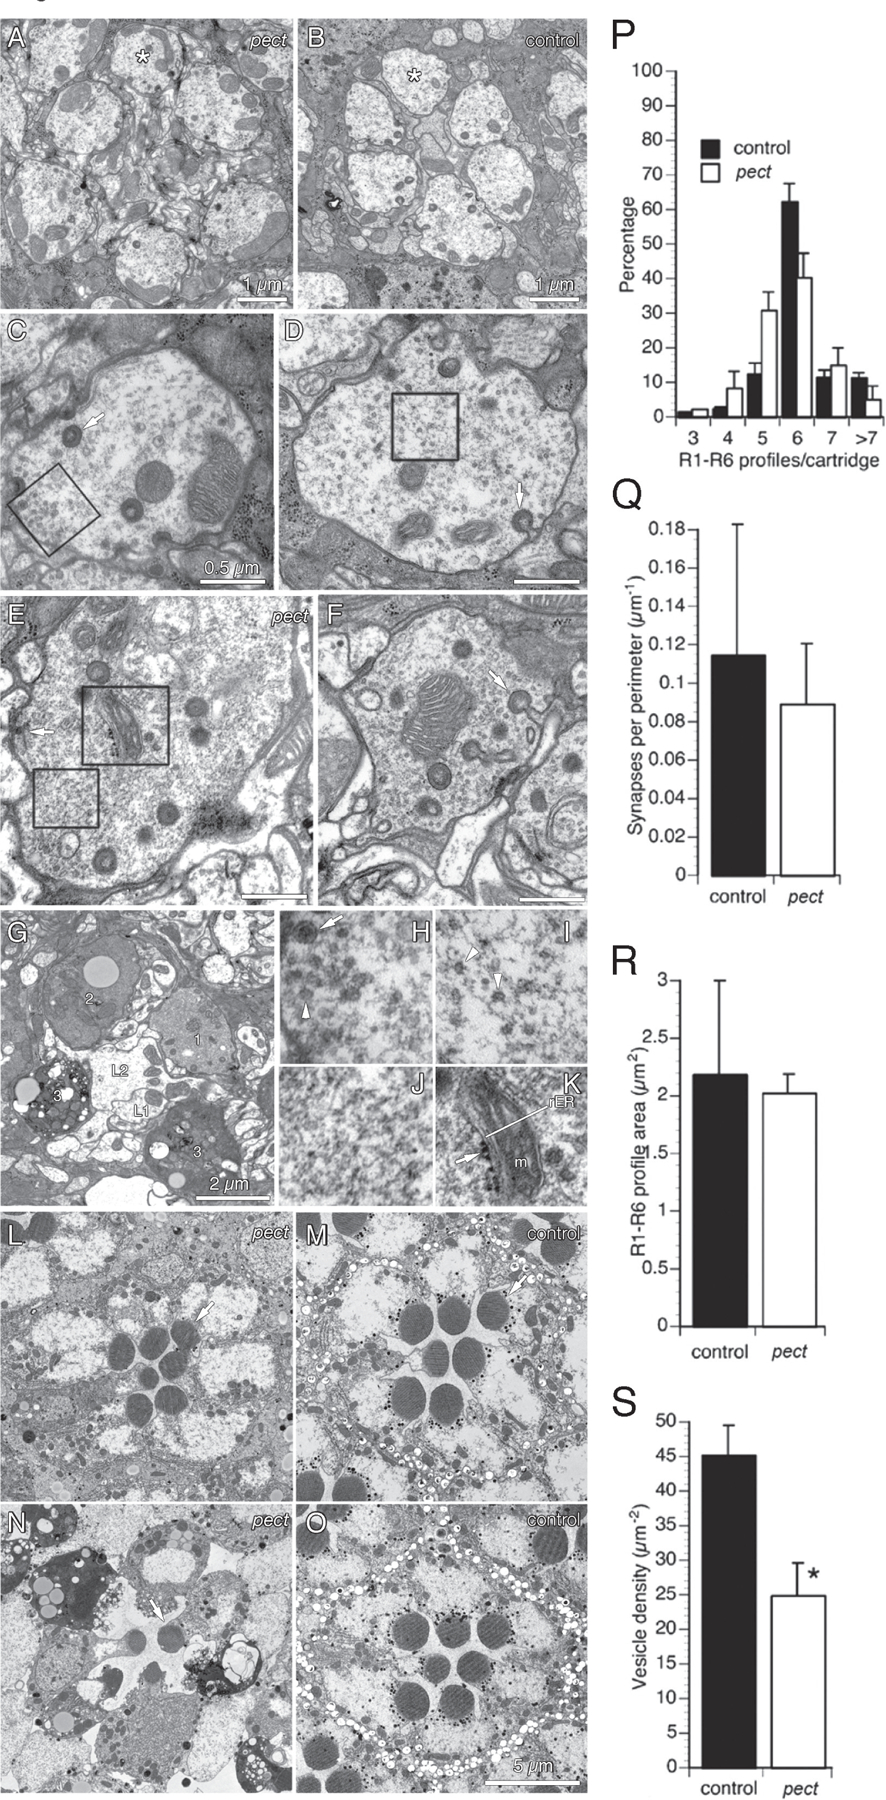
Figure 2. Ultrastructural analysis of pect mutants reveals synaptic vesicle loss and progressive degeneration.

(A, B) Pect mutant and control lamina cartridges 8 hours after eclosion. (C, D) Single pect mutant and control R1-R6 axon terminals 8 hours after eclosion. (C) Box encloses a patch of vesicles in a pect mutant R cell axon terminal, enlarged in (H). (D) Box encloses a patch of vesicles in a control R cell axon terminal, enlarged in (I). Arrow indicates an invaginating capitate projection. (E) Pect mutant R cell axon terminal. Upper box encloses structure with the morphological character of rough endoplasmic reticulum, enlarged in (K). Lower box encloses a vesicle patch, enlarged in (J). The arrow points to the pre-synaptic ribbon of a tetrad synapse. (F) Pect mutant R cell axon terminal. Arrow indicates head of an invaginating capitate projection. (G) Lamina cartridge from day 5 pect mutant. Four R1-R6 terminals surround the axons of two target interneurons, L1 and L2. The four R cell axon terminals are undergoing different stages of degeneration (labeled 1–3). (H-K) Enlargements of pect mutant R cell cytoplasm boxed in C-E. (H) ~30 nm clear synaptic vesicles (arrowhead) and ~100 nm dense core vesicle (arrow). (I) Remaining clear synaptic vesicles cluster in small patches with normal spacing (arrowheads). (J) Clear synaptic vesicles are absent in this section of a pect terminal. (K) Profiles with the morphological character of endoplasmic reticulum (rER) with ribosomes (arrow), smooth ER and mitochondrion labeled m. (L, M) Retinas of day 0 pect mutant and control flies. (N) Retina of day 5 pect mutant. Only a single R1-R6 rhabdomere (arrow) still has well preserved structure. (O) Retina of day 5 control with normal rhabdomeres. (P-U) Quantification of pect mutant R cell axon terminal defects 8 hours post-eclosion. (P) Distribution of the number of R1-R6 axon terminals per cartridge in control and pect animals. (Q) Tetrad synapse profiles per µm of R1-R6 membrane perimeter. (R) R1-R6 terminal profile areas in control and pect mutants. (S) Synaptic vesicle density in pect mutant terminals relative to control terminals. Data represented as mean ± SEM. Scale bars indicated in images. Differences significant at p < 0.01 (S) (unweighted means ANOVA, Tukey HSD test). See also Figure S2.
