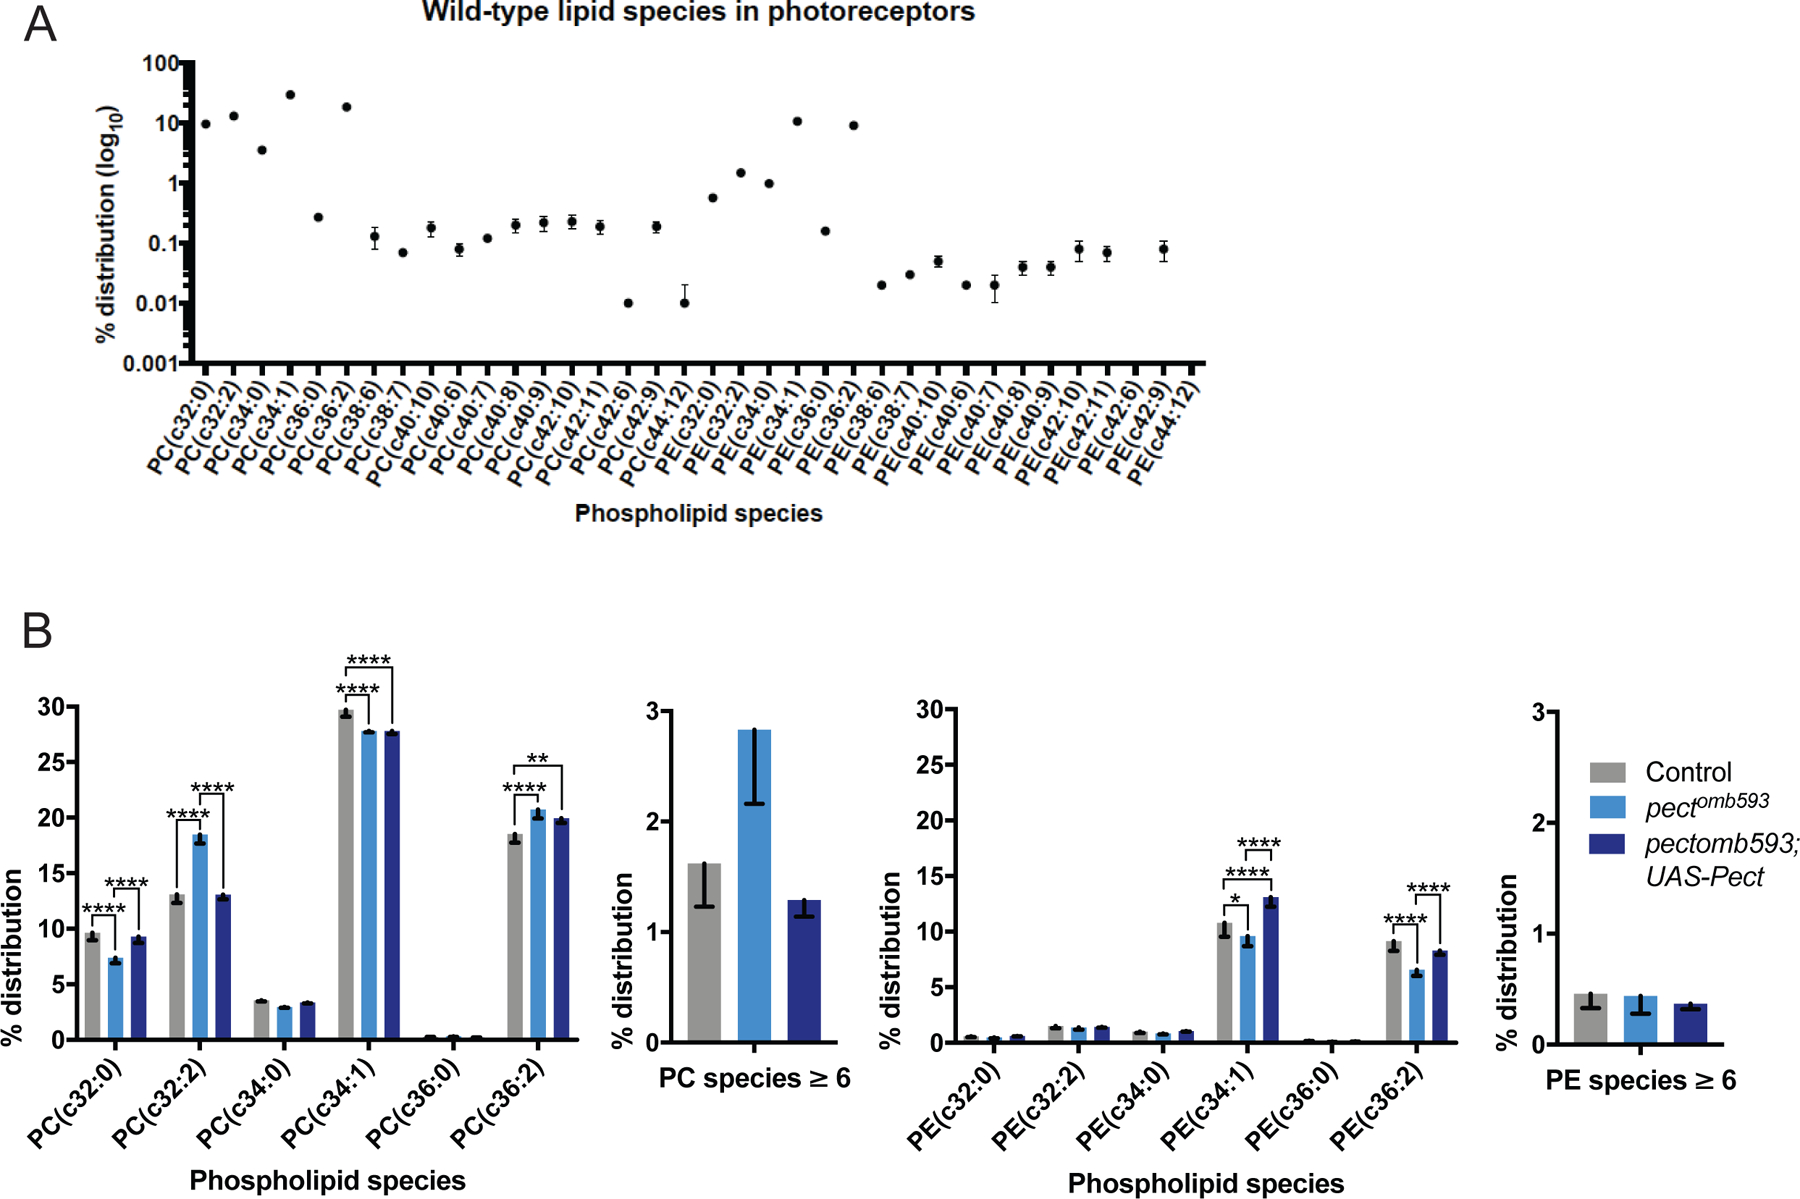
Figure 3. Pect mutants have specific changes in PC and PE phospholipid species.

(A) Quantitative measurements of PE and PC species in control retinas, displaying the relative percent contribution of each species to the total distribution of PE and PC phospholipids in the membrane. (B) Quantitative comparisons of PE and PC species between control (gray), pectomb593 somatic mosaic animals (light blue) and pectomb593 somatic mosaic animals expressing eye-specific full-length Pect (dark blue), displaying the relative percent contribution of each species. Left graphs display a subset of PC species as well as an aggregate sum of all PC species with six or more double bonds; right graphs display the same subsets of PE species as well as an aggregate sum of all PE species with six or more double bonds. Data represented as mean ± SEM. Differences significant at p < 0.01 (**), p < 0.0001 (*****) (one-way ANOVA; t-test). n = 4 replicates of 20 retinas per genotype. See also Figure S3 and Supplemental Table 1.
