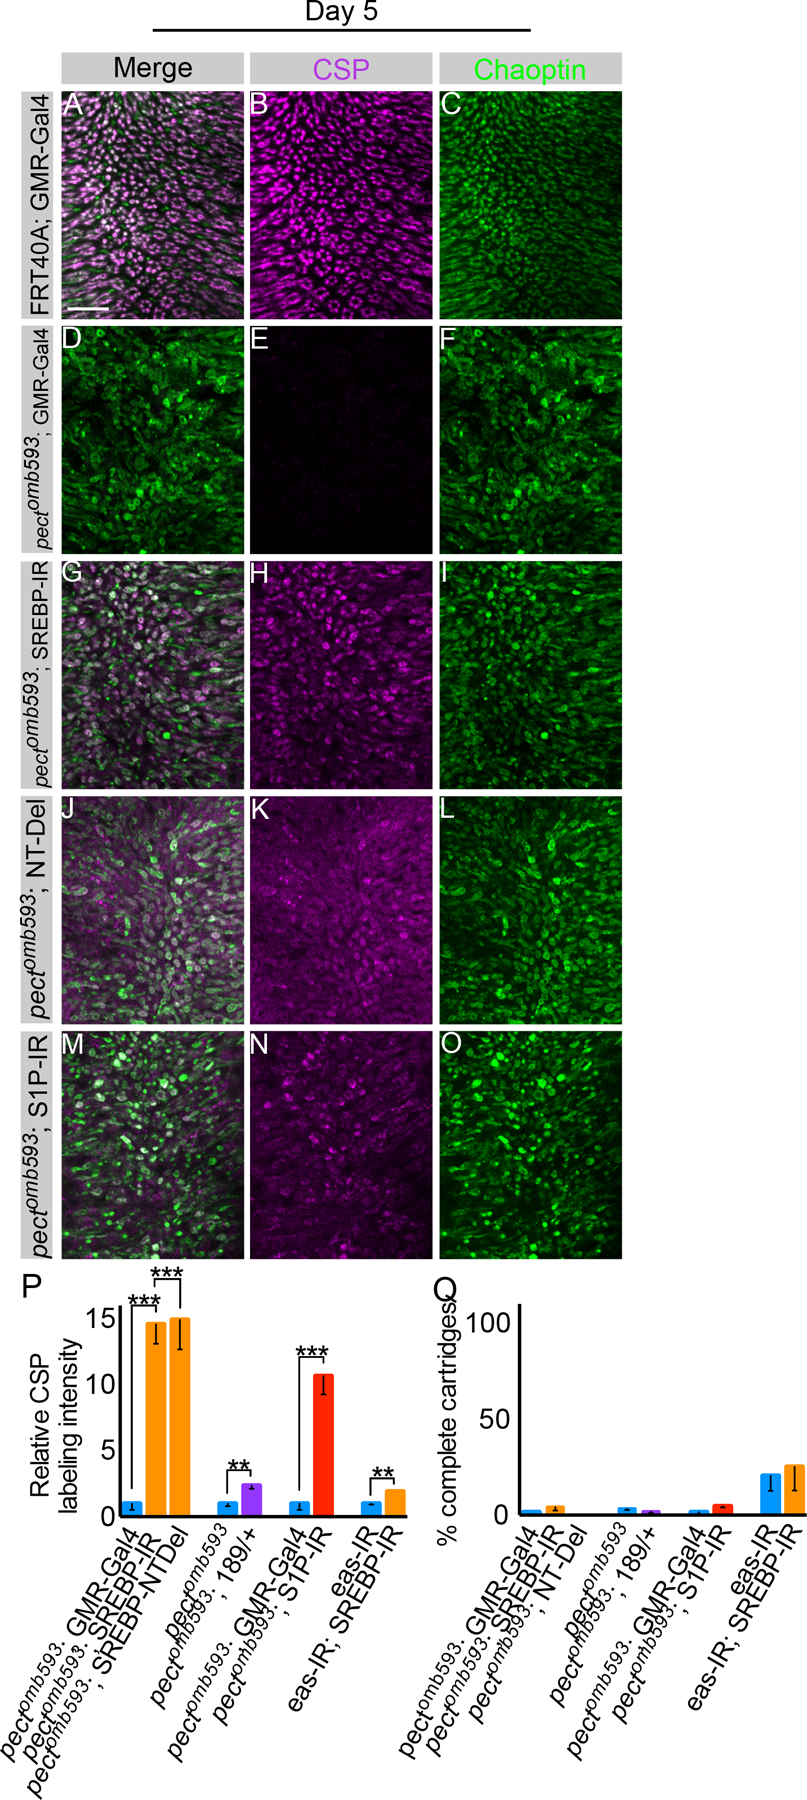
Figure 5. Pect synaptic vesicle loss requires SREBP.

Day 5 flies. (A-C) Control flies expressing GMR-Gal4. (D-F) Pectomb593 somatic mosaic animals expressing GMR-Gal4. (G-I) Pectomb593 somatic mosaic animals expressing UAS-SREBP-IR driven by GMR-Gal4. (J-L) Pectomb593 somatic mosaic animals expressing UAS-SREBP-NT-Del using GMR-Gal4. (M-O) Pectomb593 somatic mosaic animals expressing S1P-IR. (P) Relative CSP labeling intensity in pectomb593 mutants expressing UAS-SREBP-IR and UAS-SREBP-NTDel relative to pectomb593 mutants expressing GMR-Gal4 alone, pectomb593 mutants containing SREBP∆189/+ compared to pectomb593 mutants alone, pectomb593 mutants expressing SIP-IR using GMR-Gal4 relative to pectomb593 mutants expressing GMR-Gal4 alone, and eye-specific eas-IR with SREBP-IR relative to flies expressing eas-IR alone. (Q) Cartridge quantification using Chaoptin labeling for pectomb593 mutants expressing pectomb593 mutants expressing UAS-SREBP-IR and UAS-SREBP-NTDel relative to pectomb593 mutants expressing GMR-Gal4 alone, pectomb593 mutants containing SREBP∆189/+ compared to pectomb593 mutants alone, pectomb593 mutants expressing SIP-IR using GMR-Gal4 relative to pectomb593 mutants expressing GMR-Gal4 alone, and eye-specific eas-IR with SREBP-IR relative to flies expressing eas-IR. Scale bar: 15 µm. Data represented as mean ± SEM. Differences significant at p < 0.01 (**), p < 0.001 (***) (one-way ANOVA; t-test). n = 10 for each genotype. See also Figure S5.
