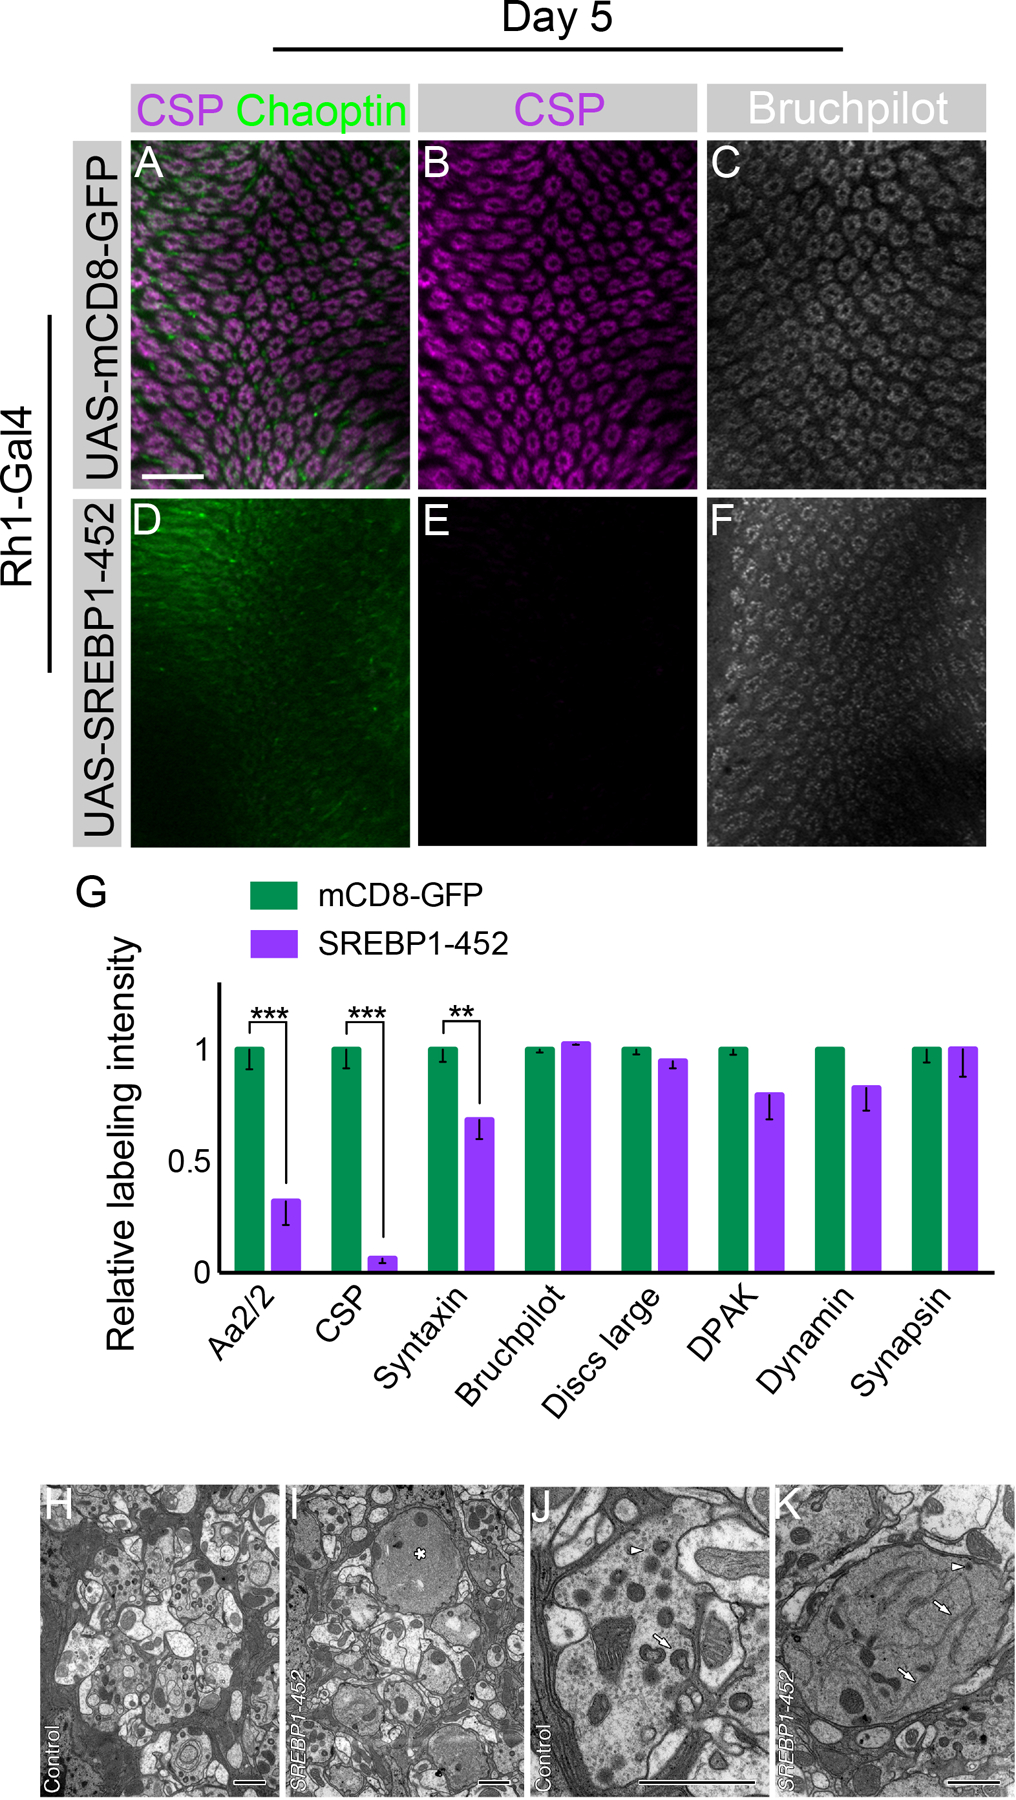
Figure 7. Activation of SREBP is sufficient to induce synaptic vesicle loss.

Day 5 flies. (A-C) Flies expressing UAS-mCD8-GFP driven by Rh1-Gal4 with CSP (magenta), Chaoptin (green), and Bruchpilot (white) labeling. (D-F) Flies expressing UAS-SREBP1-452 driven by Rh1-Gal4. (G) Quantification of relative synaptic labeling observed using several markers (Aa2/2, CSP, Syntaxin, Discs large, DPAK, Dynamin, Bruchpilot, and Synapsin) in Rh1-Gal4 >> UAS-SREBP1-452 animals relative to Rh1-Gal4 >> UAS-mCD8-GFP control. Differences significant at p < 0.01 (**), and p < 0.001 (***) (one-way ANOVA; multiple t-tests). (H, I) Single control and SREBP1-452 mutant lamina cartridges. The mutant (I) has a single, large R1-R6 terminal (*) which lacks obvious synaptic organelles. Other terminals appear largely normal. (J, K) Single control and SREBP1-452 mutant (K) R1-R6 terminals. Note the enlarged mutant terminal with extensive smooth, branched structures with the morphological character of endoplasmic reticulum profiles (arrows), single DCV (arrowhead), and capitate projections, lacking in this profile, but which are abundant in the control terminal (arrow, J). Note also the presence of numerous synaptic vesicle profiles (arrowhead) in the control terminal (J) that are lacking in the mutant (K). These form no clear clusters but are distributed throughout the profile of the terminal. Data represented as mean ± SEM. Scale bar: 15 µm (A-F), 1 µm (H-K). n = 10 for each genotype. See also Figure S7.
