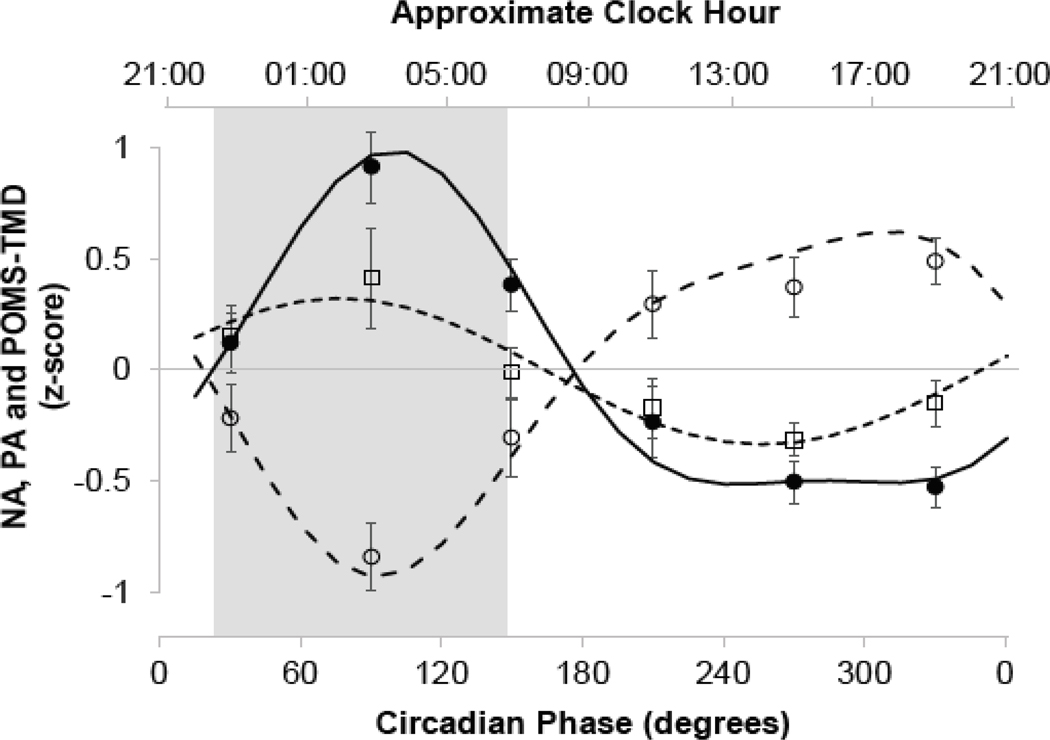
Figure 1:
Endogenous circadian rhythms in mood. Shown are z-scores (mean ± SEM) for the PANAS negative (□) and positive (○) affect scores, and POMS-B total mood disturbance (TMD) score (●). Data are plotted accordingly to circadian time in bin sizes of 60° (~4 hours) with the DLMO defined as 0°. Mixed model cosinor analyses (conducted on non-binned data) are shown for PANAS negative (---) and positive (– –) affect scores, and POMS-B TMD (—). The shaded rectangle corresponds to the participants’ average sleep timing prior to entering the laboratory. For all analyses, p<0.05.

